 Buy Crypto
- Markets
 Futures
- Spot
- Copy Trade
- Earn
- More
Opinion: Bitcoin's 10-point Plunge Wasn't All Jane Street's Fault
Original Title: Notice Bitcoin selling off at market open? Jane Street is taking the blame, but the data points elsewhere
Original Author: Oluwapelumi Adejumo, CryptoSlate
Original Translation: DeepTech TechFlow
DeepTech Summary: Bitcoin recently surged to $70,000, triggering a conspiracy theory linking Jane Street to the "stock market open sell-off." This article systematically dismantles this claim from three dimensions: on-chain data, ETF structure, and options positions, concluding that the real issue is not Jane Street but the price discovery black box of the ETF era—opacity in institutional hedging that is making it increasingly challenging for retail investors to understand the market.
Full Text:
Bitcoin surged close to $70,000 in the past 24 hours, rekindling a familiar debate in the crypto market: do Wall Street institutions operating in the spot ETF ecosystem wield too much influence over price discovery?
The target this time is Jane Street—this quant trading firm is both a significant ETF market maker and a defendant in a new lawsuit related to the 2022 Terraform Labs collapse.
On social media, traders have linked Bitcoin's recent surge to a claim: alleging a mid-day price plunge pattern near the U.S. stock market open that suddenly vanished after the lawsuit was made public.
This theory spread rapidly as it blended two long-standing resonant views: distrust of large trading institutions and unease about the increasing integration of the Bitcoin market through traditional financial channels.
However, the evidence supporting the "coordinated Bitcoin suppression" scheme remains weak.
This event more evidently reveals that the structure of the spot Bitcoin ETF has made it increasingly challenging for many investors to distinguish true spot demand from market-making, hedging, and arbitrage activities.
In this sense, the Jane Street controversy transcends accusations against a single institution. At its core is how Bitcoin's new institutional infrastructure is shaping price discovery and whether the market is becoming more efficient or increasingly opaque.
Origin of the Jane Street Bitcoin Rumor
The rumor took shape after Bitcoin saw a significant rebound for two consecutive trading days. Users on X began claiming that the so-called "10 AM dump program" had vanished.
Notably, X account Negentropic, operated by Glassnode co-founders Jan Happel and Yann Allemann, played a key role in propagating this theory. They asserted: "Jane Street lawsuit being public has miraculously erased the 10 AM Bitcoin dump."
This claim quickly gained attention as Jane Street is no stranger to the scene. It is one of the world's largest trading firms and a prominent participant in the Bitcoin ETF market, serving as an authorized participant for IBIT (BlackRock's Spot Bitcoin ETF).
In practice, this positions them tightly in the core mechanism to keep the ETF share price in line with the underlying holdings' value.
Simultaneously, ongoing legal disputes involving the company further fueled the controversy.
The liquidators of Terraform Labs filed a lawsuit in Manhattan, accusing institutions including Jane Street of profiting from material non-public information related to Terraform's liquidity operations during the TerraUSD crash in May 2022.
The complaint alleges that Terraform withdrew $150 million of TerraUSD liquidity from Curve's 3pool, with wallets associated with Jane Street withdrawing around $85 million within minutes before this information became public.
Jane Street has denied any wrongdoing, labeling the lawsuit as a desperate attempt by Terraform to shift responsibility for its own actions during the loss.
This lawsuit does not prove anything about current Bitcoin trading.
However, it explains why traders quickly connected Jane Street with an observable market pattern. In the crypto world, trust is often fragile, and an institution accused in one market event often becomes a suspect in the next.
Industry Insiders Refute the Rumor
Given the above context, some Bitcoin traders believe that this top cryptocurrency has faced mechanical selling around the US stock market's open and close for months, liquidating long positions and creating liquidity vacuums in thin order books.
If this sell-off disappears after Jane Street faces new legal pressure, perhaps the firm has been pressuring the market.
Furthermore, the company's early association with FTX founder Sam Bankman-Fried has also cast a shadow over its image. Bankman-Fried worked at this trading firm before founding FTX.
This narrative is emotionally compelling but much harder to assert than to prove.
On-chain analyst James Check from Checkonchain directly refuted this argument, writing that Jane Street did not suppress Bitcoin; long-term holders selling spot drove the price action better.
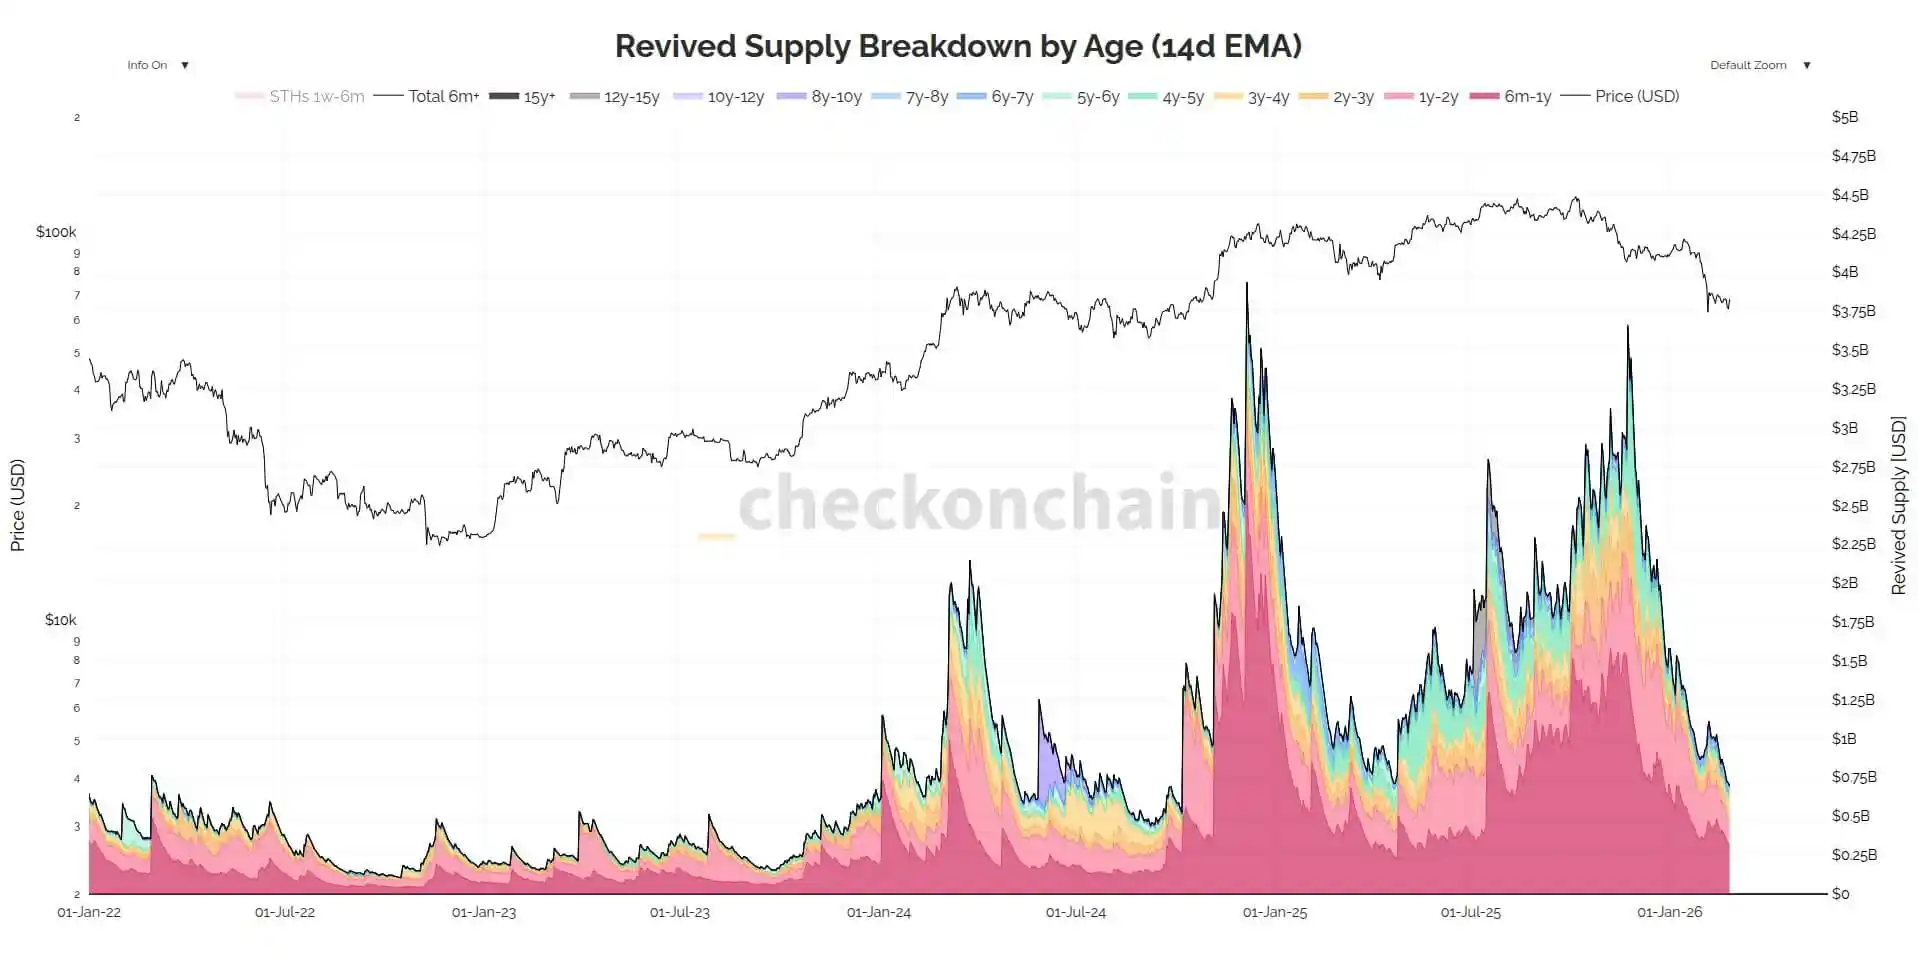
Julio Moreno, Research Director at CryptoQuant, also shares a similar view, believing that this theory overlooks a more apparent driving factor: a sharp decline in Bitcoin spot demand since early October 2025.
He further added that the operational mechanism attributed to Jane Street is similar to the delta-neutral position management widely adopted by many trading firms.
The value of these rebuttals lies in their direct pointing out of the core weakness of the rumor: Bitcoin was already under broader macro repricing pressure well before entering 2026.
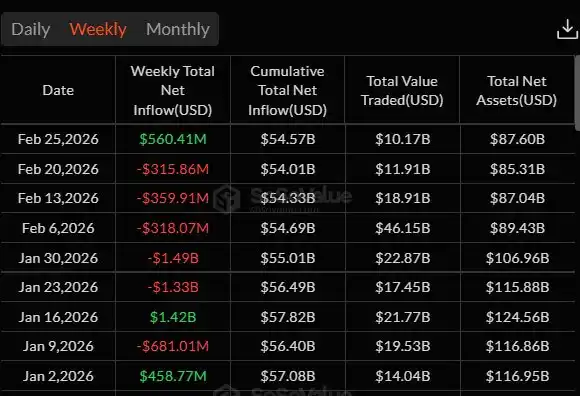
SoSo Value data shows that institutional investors have reduced Bitcoin ETF exposure for five consecutive weeks, with net outflows from spot Bitcoin ETFs totaling around $4.5 billion.
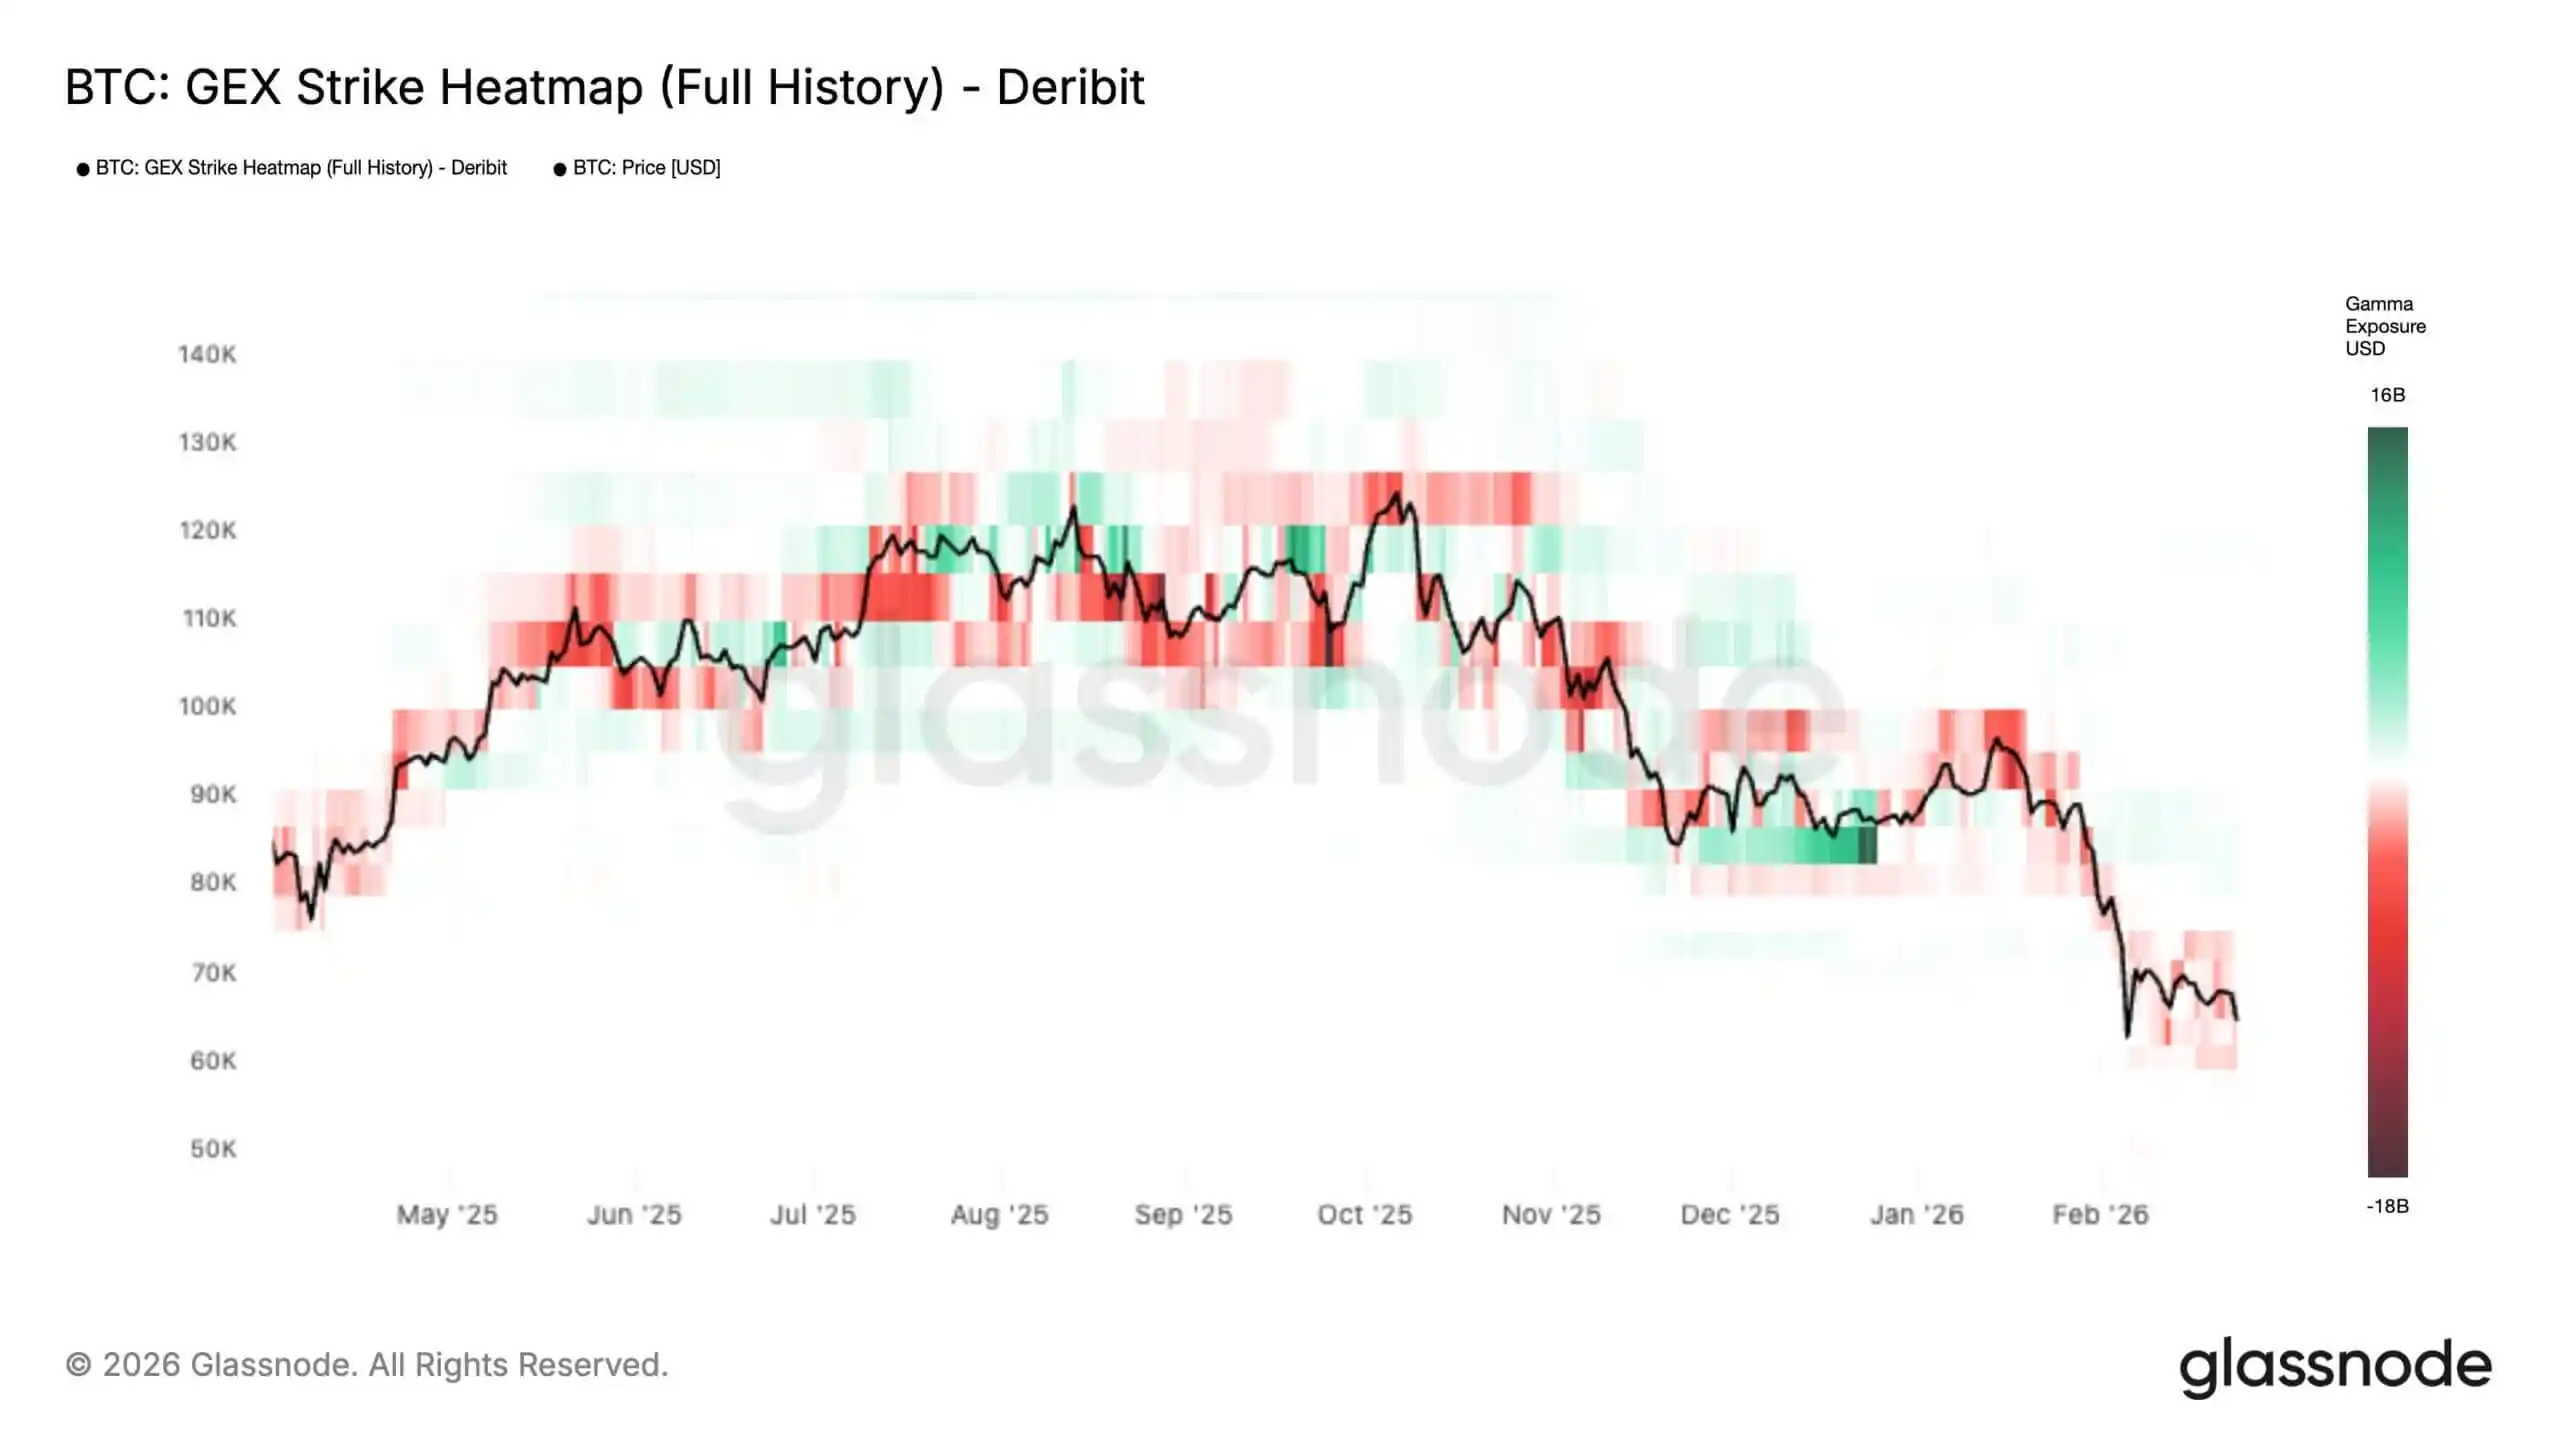
Meanwhile, Glassnode data indicates that the recurrent market pressure earlier this month has triggered a structural shift in the Bitcoin options market toward a more unstable regime.
The institution noted that the historical gamma exposure (GEX) heatmap shows that negative gamma in the current price and below region is expanding, while the positive gamma "resistance wall" above the spot price is diminishing.
In layman's terms: the options positions that typically act as shock absorbers are fading out, leaving the market more exposed to a scenario where hedging flows no longer cushion the fall but amplify it.
This dynamic is crucial: when the price is in a short-gamma range, market makers' delta hedges tend to follow the market rather than sell on the decline and buy on the rise.
The result is that the market can move faster and further on a relatively small catalyst - with larger intraday swings and a higher risk of cascading moves through key levels - until Bitcoin hits the next thick "gamma wall," at which point the hedging switches back to buffer mode.
In other words, traders are operating in an environment where "intent" is easily seen anywhere. When liquidity is thin and leverage is high, almost any sharp move can look like organized behavior.
The ETF Pipeline Is Harder to Read Than It Seems
The deeper issue raised by the Jane Street controversy is structural, not targeted at a specific institution.
As articulated by Jeff Park, Chief Investment Officer of ProCap Financial, the real issue is not whether a particular company is "exclusively suppressing" Bitcoin, but whether the ETF market structure gives authorized participants an opaque discretionary space.
This is significant because investors often rely on ETF disclosure data as a clean directional signal - but that's not the reality. While a 13F filing may show a large long ETF position, SEC guidance makes it clear that short positions are not included, and short options do not offset against long net positions.
In practice, the market may see the inventory but not the futures, options, or other hedging instruments wrapped around it.
This opacity is further compounded by the way trust is constructed. BlackRock's documentation on IBIT shows that the Trust can create and redeem shares through authorized participants and trade with designated Bitcoin counterparties.
As of that filing, these counterparties include affiliate JSCT, LLC of Jane Street Capital, and affiliate Virtu Financial Singapore of Virtu Americas.
The document also reveals that the list of authorized participants has expanded to include JPMorgan, Citadel Securities, Citigroup, Goldman Sachs, UBS, and Macquarie, among others, with more and more firms gaining access to the ETF creation/redemption mechanism.
Park's view is that this structure distorts outsiders' interpretation of ETF fund flows.
In the old cash model, creating ETF shares required the fund to buy physical Bitcoins. However, after the SEC approved the creation and redemption of crypto ETPs in July 2025, authorized participants gained greater flexibility in obtaining and delivering the underlying assets.
The SEC has stated that this change will reduce product costs and increase efficiency. However, it also means that authorized participants' exposure can be managed through a wider range of tools and counterparties, making it more difficult to determine when ETF activity reflects genuine spot demand, inventory management, basis trading, or hedging construction.
None of this is conclusive evidence of misconduct, and Park's argument does not rely on proving misconduct by Jane Street or any other company. His sharper point is this: the Bitcoin ETF era has inserted a black box between publicly available position data and the underlying price discovery process.
The initiation of a trade may look like ordinary market-making activity, as does the endpoint. What is hard to observe is the middle link: whether hedging is done through spot, futures, swaps, or some combination of the three, and whether natural arbitrage mechanisms truly transmit real spot demand to Bitcoin.
This is precisely why the Jane Street rumor struck a chord. It is less an accusation against a particular participant and more of a signal—a revelation of how limited the market's understanding of its own operational plumbing is.
Why Does the U.S. Stock Market Open Feel Like a Sell Zone?
The "10 a.m. Theory" makes sense, as even without intentional manipulation, the U.S. stock market open is naturally a period of real volatility.
This period is characterized by cross-asset rebalancing, stock-specific risk adjustments, and derivative hedging operations.
In markets where ETF intermediaries can hedge inventory with futures or other instruments, futures may pull the spot price and not just follow it.
During thin order book moments, these actions may appear larger and more conspiratorial than they actually are. Bloomberg reported earlier this month that Bitcoin market depth remains over 35% lower than October levels, highlighting how fragile liquidity has become.
Meanwhile, macro analyst Alex Kruger has stated that existing data does not support the claim of "systematic sell-off every day at 10 a.m."
He wrote that since January 1, IBIT has had a positive cumulative return of 0.9% in the 10:00–10:30 a.m. Eastern Time window, while the 10:00–10:15 a.m. window has seen a 1% decline.
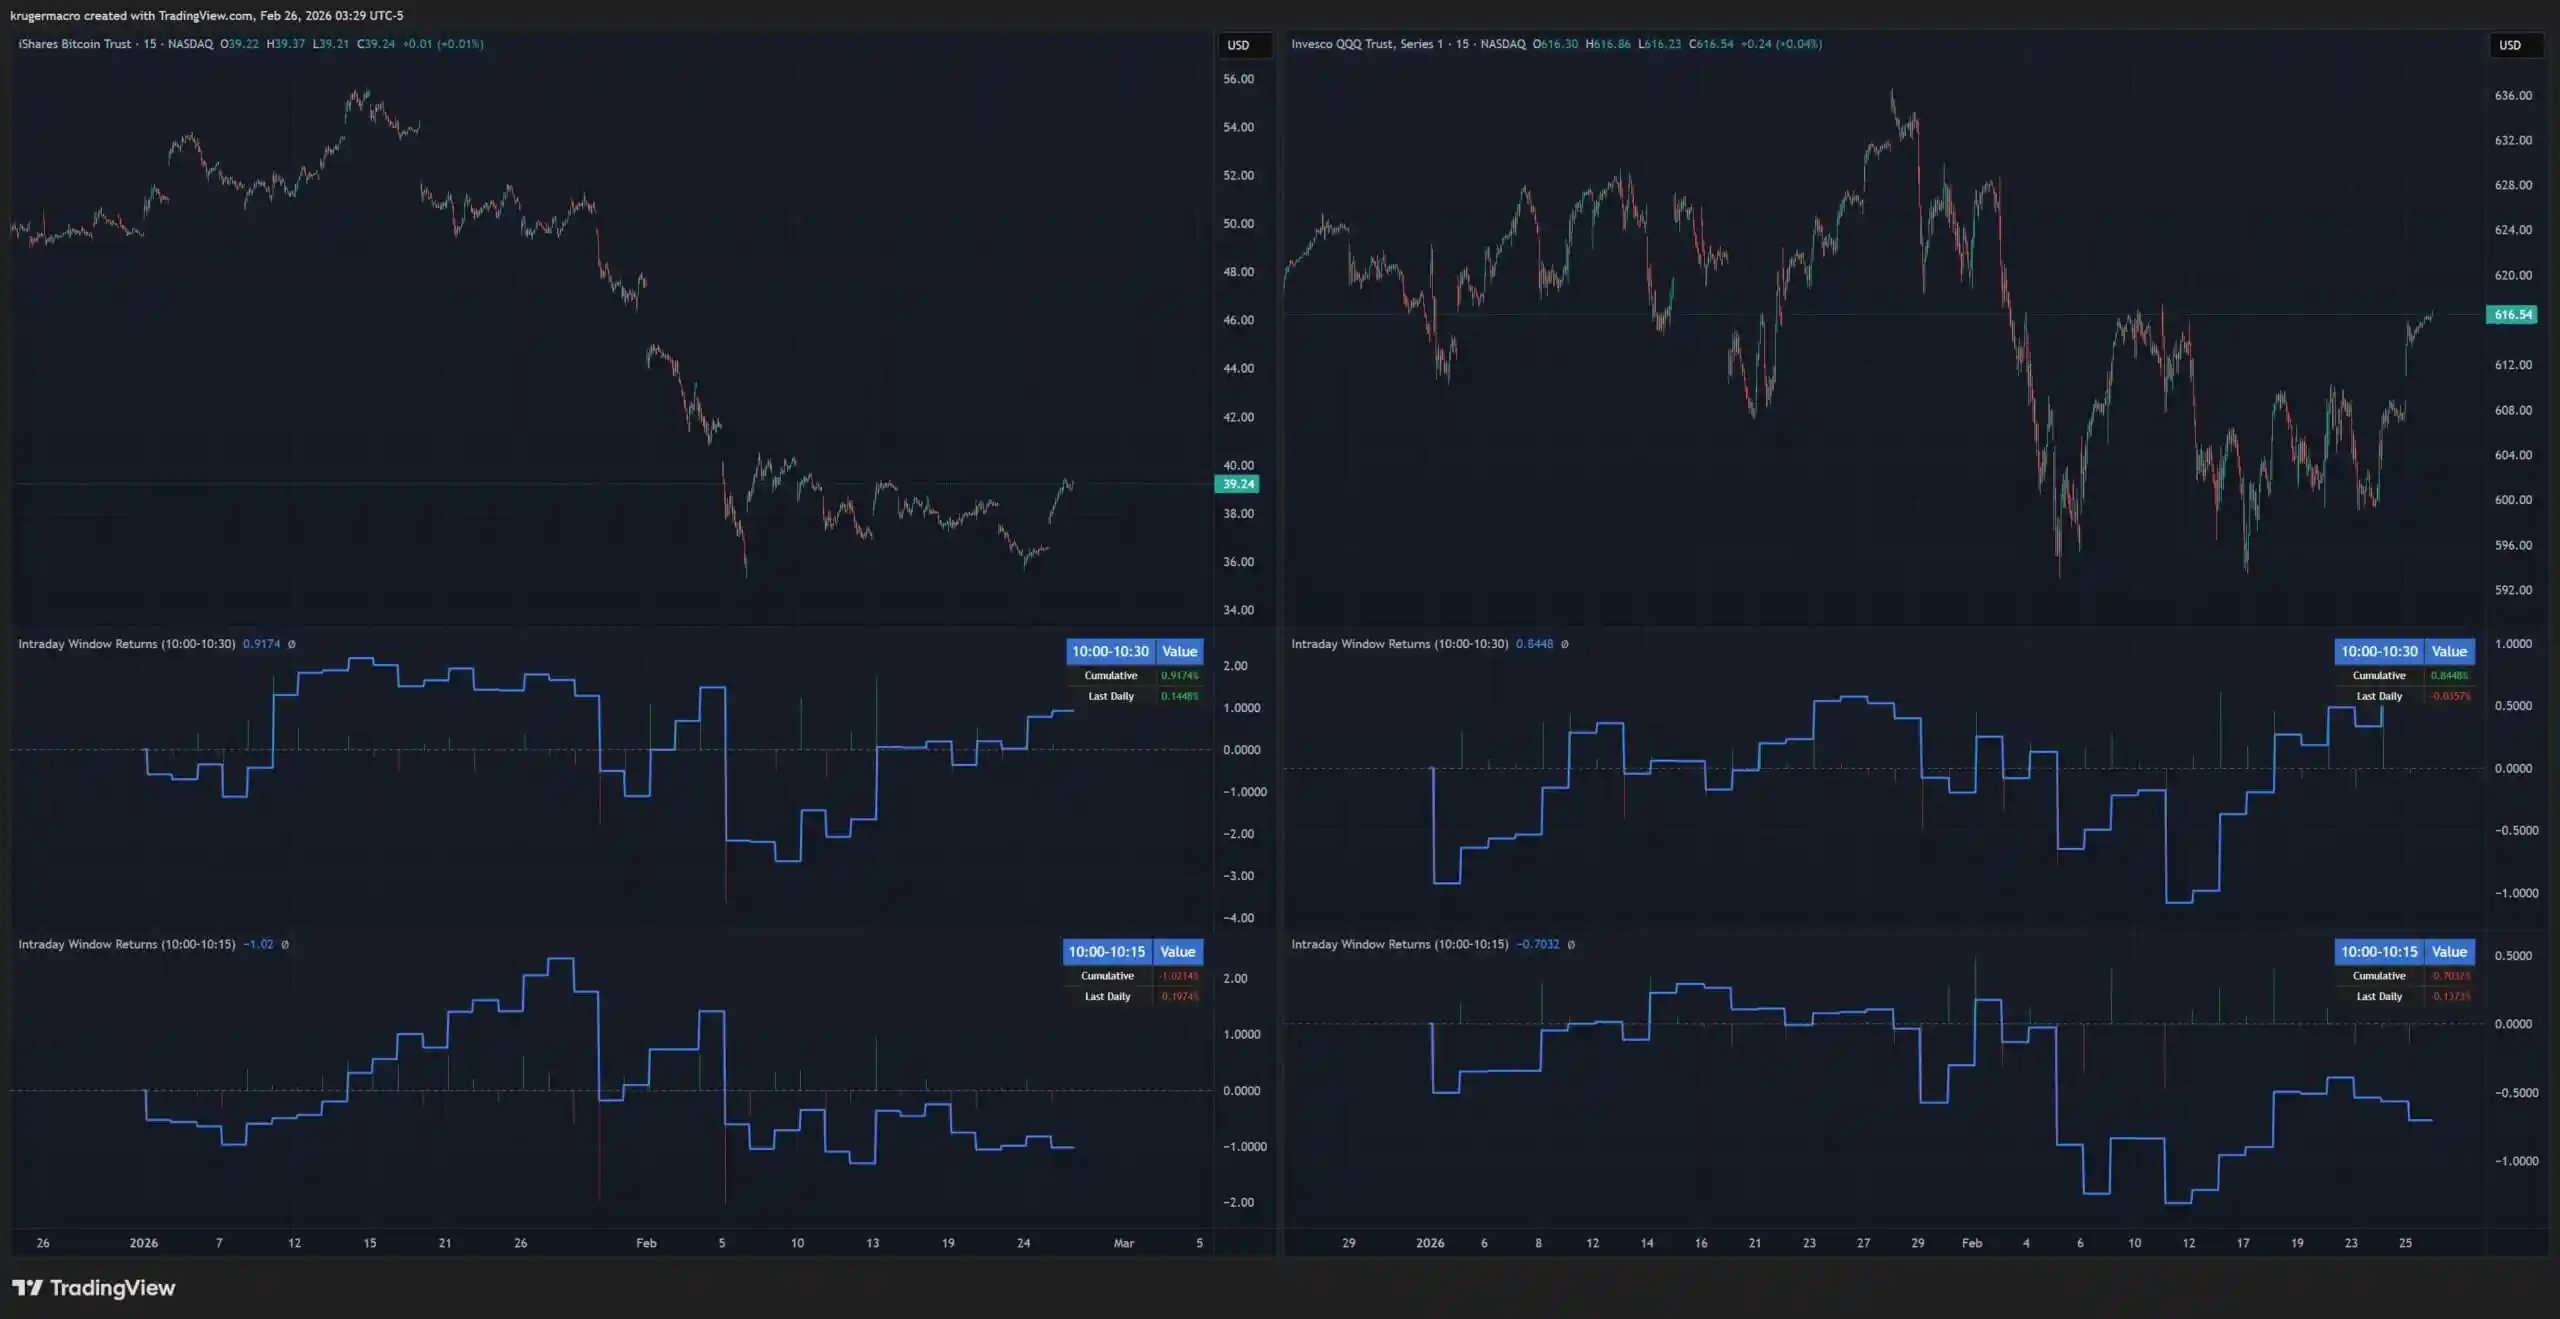
In his view, this is noise, not evidence of a replicable suppression program.
Moreso, he says that the performance patterns of these two windows closely match those of the Nasdaq, indicating this is a broad-based repricing of risk assets, not a Bitcoin-specific operation.
This narrative is more in line with broader market context than a viral spread story.
If bitcoin is increasingly traded through ETF packaging as a macro risk asset, then the pressure at U.S. market open—especially in a thin liquidity market—repeatedly inducing bitcoin weakness in the same intraday window should not be surprising.
On-chain scarcity clear, price discovery not so
Bitcoin's supply is protocol-defined. No change in ETF market structure can alter this. What does change is the increasing proportion of demand—and scrutiny—that now flows through.
The Jane Street controversy unveils the gap between these two realities. On-chain scarcity is transparent, overlaid institutional plumbing less so.
Investors can see ETF circulating shares and partially disclosed holdings but cannot see every hedge, every internal net exposure, or every cross-market position that may lurk behind a market maker's book.
This blindspot creates room for misapprehension and also for distrust.
Jane Street has faced scrutiny in other markets as well, which does not help improve the situation. In July 2025, the Securities and Exchange Board of India issued an interim order relating to an index manipulation case involving Jane Street entities, with Reuters later reporting that SEBI had barred the firm from the Indian securities market during the case investigation. Jane Street also denied any wrongdoing there.
The India case is unrelated to bitcoin, but it explains why when Jane Street's name surfaced in headlines again, crypto traders were prepared to think the worst.
However, existing facts do not prove Jane Street executed a deliberate bitcoin suppression agenda.
What they prove is another thing: the post-ETF era bitcoin market has become more accessible, more institutionally integrated, and yet more inscrutable for the average investor.
You may also like

Gate founder Dr. Han: The crypto winter drives structural reshaping, and everything on-chain will become a new paradigm in finance

Is XRP a Good Investment in 2026? Why Is It Stuck at $1.45
XRP is up 6.7% this week, but exchange reserves remain high. Is a volatility spike imminent? We analyze price trend, ETF inflows, whale activity, and regulatory catalysts to answer: will XRP go up, why is XRP dropping, and is XRP a good investment right now?
TL; DR
What is XRP: XRP is a digital asset built for fast, low-cost international payments. It runs on the XRP Ledger and is used by Ripple for its On-Demand Liquidity (ODL) service. Unlike Bitcoin, XRP settles transactions in 3-5 seconds with near-zero fees.Why is XRP Dropping: XRP is not actively dropping, but it is struggling to rise. On the monthly chart, XRP has seen six consecutive months of decline. Currently, the price faces an additional supply wall at $1.45. About 1.24 billion XRP were bought in that range, and those holders sell when the price approaches, creating selling pressure that prevents a recovery.Will XRP Go Up: Potentially yes. XRP is trading near $1.43 and showing its best weekly performance since September 2025. If the price breaks above the $1.45 resistance, analysts expect a move toward $1.90, supported by strong institutional demand.Is XRP a Good Investment: The answer is not simple. Short-term traders may see opportunity in the coming volatility spike. Long-term investors face a bigger question that depends on one key regulatory event. However, the data reveals a surprising signal that most retail buyers are missing right now. To understand whether XRP is a smart buy or a trap at $1.43, you will need to read the full analysis below.What is XRP? A Digital Asset for Global SettlementBefore analyzing the charts, it is crucial to understand the asset in question. What is XRP? Unlike Bitcoin, which was designed as a decentralized digital gold, XRP operates on the XRP Ledger (XRPL). It was created to facilitate fast, low-cost international payments. Traditional bank transfers take days and incur high fees. XRP transactions settle in 3-5 seconds, costing fractions of a penny.
Ripple, the company associated with XRP, uses this asset for its "On-Demand Liquidity" (ODL) service. Banks and financial institutions use ODL to source liquidity during cross-border transactions without pre-funding accounts. This utility is the primary driver for institutional interest. Recently, the network hit a milestone of over 8 million active wallets, signaling growing usage despite recent price stagnation . Furthermore, Ripple is proactively preparing for the future, releasing a four-stage roadmap to make the XRPL "quantum-resistant," aiming to secure the ledger against future quantum computing threats by 2028 .
XRP Price Analysis: The Battle for $1.45The XRP price trend over the last month tells a story of exhaustion followed by cautious recovery. On the monthly chart, XRP experienced six consecutive months of decline. However, April shows signs of a bottoming process. Weekly charts reinforce this view: after four weeks of lower closes, the last two weeks have seen small rebounds.
According to data from April 22, 2026, XRP is trading at approximately $1.44. Over the last seven days, XRP has outperformed both Bitcoin and Ethereum, rising 6.7% while the broader market rose only 3.2%. Spot trading volume surged 23% to $3.79 billion, and derivative markets saw $40 billion in futures volume on a single day.
Despite this, the price remains 60% below its July 2025 high of $3.65. The current technical picture shows a "low volatility grind" higher. The 20-day EMA is at $1.3924, and the 50-day EMA is at $1.4119, both acting as support . However, the immediate hurdle is the $1.45 resistance level. This price point has rejected every rally attempt in 2026.
Why is XRP Dropping? And Will XRP Go Up?The primary reason for the recent "drop" (or lack of upward momentum) is not active selling, but rather the "supply wall." Data indicates that roughly 1.24 billion XRP tokens were purchased by investors in the $1.45 to $1.47 range. These investors have been waiting months to "break even." Every time the price approaches $1.45, these holders sell to exit their positions, creating a massive wall that retail buying cannot easily absorb.
However, the underlying momentum is shifting. Analysts suggest a xrp volatility spike imminent because the absorption capacity of buyers is increasing. Historically, when exchange reserves are high but the price refuses to drop significantly, it signals that buyers are absorbing the supply. The price has held above $1.39 despite the overhang, which is a sign of relative strength.
So, will XRP go up? Yes, potentially. But it needs a catalyst, if the price closes a daily candle above $1.45. If that happens, the next targets are $1.60 to $1.65, and eventually $1.90 .
XRP Exchange Netflow and XRP ETF Netflow: A Tale of Two MarketsThe current market dynamic is best understood by looking at two opposing data streams: XRP Exchange netflow and XRP ETF flows.
Exchange Dynamics (Retail / Whales):
Data shows a complex pattern of "large inflows and increasing reserves." Recently, a Ripple-associated wallet moved 75 million XRP (approx. $108 million) to Coinbase. This initially looks like a dump, but context matters. These transfers are likely to provide liquidity for Ripple’s ODL business, not necessarily spot market selling. However, the result is that exchange reserves have climbed to 2.76 billion XRP .
The Good News: While reserves are high, the rate of increase is slowing. Specifically, "whale" transfers to exchanges have dropped 98% from their April 11 peak. The Binance reserve has slightly decreased from 27.7 to 27.6 billion. The aggressive selling from large holders appears to have stopped.
Institutional Dynamics (ETF):
While whales were sending coins to exchanges, institutions were buying XRP ETF products. XRP ETF net flow is strongly positive.
US-listed XRP ETFs recorded four consecutive days of inflows totaling $38.86 million recently .The weekly inflow for mid-April hit $119.6 million, a multi-month high .Cumulative net inflows stand at $12.8 billion, with Assets Under Management (AUM) at roughly $10.8 billion.Analyzing the Divergence: Why Both Flows Are PositiveIt seems contradictory that exchange reserves are high (suggesting selling) while ETFs are buying (suggesting buying). However, this phenomenon reveals the current market structure.
Different Investor Profiles: The exchange inflows likely come from short-term traders, market makers, or Ripple itself providing ODL liquidity. These are "hot" coins ready to be sold. The ETF inflows represent "sticky" capital. Institutions buying ETFs are typically long-term holders (LTHs) or asset managers who do not day-trade. They are removing liquidity from the spot market by buying through custodians.The "De-risking" Trade: Sophisticated funds might be engaging in basis trading. They buy the ETF (taking a long position) while simultaneously shorting XRP futures or selling spot inventory to capture the funding rate. This keeps the price stable while volume increases.Absorption: The most likely scenario is that the market is simply absorbing the excess supply. The fact that the price is stable ($1.43) and not collapsing to $1.20 despite 2.76 billion coins sitting on exchanges is a massive win for the bulls. The ETF inflows are acting as a sponge, soaking up the selling pressure from the ODL wallets.The Regulatory Catalyst: The SEC and the CLARITY ActFundamentally, the recent price action cannot be separated from regulation. For years, the primary answer was the SEC lawsuit. That narrative is dying.
Ripple CEO Brad Garlinghouse recently praised SEC Chair Paul Atkins as "a breath of fresh air and sanity" . This regulatory thaw is critical. The SEC is reportedly considering dropping the long-standing lawsuit, and five XRP ETF applications are awaiting review.
The major catalyst on the horizon is the CLARITY Act. A Senate markup is expected before the end of April. Standard Chartered analysts project that if the bill advances, it could unlock $4 to $8 billion in institutional flows . Polymarket gives the bill a 60-66% chance of passing in 2026. If the CLARITY Act classifies XRP as a non-security (commodity), the institutional floodgates will open, likely overwhelming the $1.45 supply wall instantly.
Is XRP a Good Investment in 2026?Given all this data, is XRP a good investment? The answer depends entirely on your risk tolerance and time horizon.
The Bull Case (Why it is a good investment): The risk/reward ratio is asymmetrical to the upside. The price is near multi-year lows relative to its utility. Whale selling has stopped, ETF demand is rising, and the network is expanding (8 million wallets, quantum resistance roadmap). If the CLARITY Act passes, XRP could realistically trade between $1.60 and $1.80 in the short term, with a potential run to $3.00+ if the lawsuit is officially dropped.The Risk Case (Why it is NOT a good investment): There is a clear resistance wall at $1.45. If the CLARITY Act fails or is delayed past May (due to midterm election dynamics), the "buy the rumor, sell the news" dynamic could reverse. If the price fails to break $1.45 and loses support at $1.33, a drop back to $1.15 is technically possible .Verdict: XRP is a speculative buy for traders looking for a volatility spike. It is a hold for current investors. For new investors, it is only a good investment if you believe in regulatory clarity within the next 30 days. Technically, waiting for a confirmed break above $1.55 (to avoid the fakeout) is safer than buying at $1.43.
FAQQ: Will XRP go up if the CLARITY Act passes?
A: Yes, historically. Analysts predict that if the CLARITY Act passes, signaling that XRP is a commodity, it would remove the regulatory overhang. This could trigger a surge in institutional buying, pushing the price from the current $1.43 range to test the $1.80 - $2.00 resistance levels quickly.
Q: Why is XRP dropping when Bitcoin is going up?
A: XRP has specific supply dynamics. Unlike Bitcoin, which has a fixed supply issuance, XRP faces periodic sell-pressure from Ripple's treasury wallets used to fund ODL (liquidity) services. Additionally, the $1.45 "break-even" wall causes XRP to drop relative to BTC when short-term traders exit.
Q: Is a volatility spike imminent for XRP?
A: Yes. The Bollinger Bands on the daily chart are squeezing. The price is stuck between support at $1.33 and resistance at $1.45. Historically, when XRP volume surges 23% in a week (as it did on April 21), it precedes a violent move. The direction depends on whether the $1.45 resistance breaks.
Q: What is the XRP ETF netflow status?
A: As of late April 2026, XRP ETFs are seeing positive netflows. The US ETFs recorded a single week inflow of $119.6 million in mid-April. Cumulative inflows are strong at $12.8 billion, indicating that institutions are accumulating during this dip, which is a long-term bullish signal for price stabilization.
Q: Is XRP a good investment for beginners?
A: XRP is less volatile than "meme coins" but more volatile than Bitcoin. For beginners, it is a moderate-risk investment. Its value is tied to real utility (bank payments). However, beginners should wait to see if the price can close a weekly candle above $1.55 before entering, to avoid buying into the current resistance wall.
Disclaimer: None of the information in this article constitutes, or is intended to constitute, investment advice. Trading cryptocurrencies carries a high level of risk and may not be suitable for all investors. Always do your own research.
About WEEXFounded in 2018, WEEX has developed into a global crypto exchange with over 6.2 million users across more than 150 countries. The platform emphasizes security, liquidity, and usability, providing over 1,200 spot trading pairs and offering up to 400x leverage in crypto futures trading. In addition to the traditional spot and derivatives markets, WEEX is expanding rapidly in the AI era — delivering real-time AI news, empowering users with AI trading tools, and exploring innovative trade-to-earn models that make intelligent trading more accessible to everyone. Its 1,000 BTC Protection Fund further strengthens asset safety and transparency, while features such as copy trading and advanced trading tools allow users to follow professional traders and experience a more efficient, intelligent trading journey.
Follow WEEX on social mediaX: @WEEX_Official
Instagram: @WEEX Exchange
Tiktok: @weex_global
Youtube: @WEEX_Official
Discord: WEEX Community
Telegram: WeexGlobal Group

FC Barcelona vs Celta Vigo: Can Anyone Stop Barcelona at Home?
FC Barcelona vs Celta Vigo lineups, standings, and stats for April 22, 2026. FC Barcelona need a win to stay on track for the La Liga title. Full preview inside.
Carl Moon & WEEX Head to Mugello: The Crypto Trader's Ferrari Challenge
Forget the sidelines. WEEX is hitting the 300km/h mark at Mugello this weekend. Witness Carl Moon’s transformation from a supermarket cashier to a Ferrari racer, and discover why the world’s fastest trading floor belongs on the world’s most technical track at the official Ferrari Challenge.

How to Become a Pro Crypto Trader: WEEX Interview with Ferrari Racer Carl Moon
Ferrari racer Carl Moon on mastering crypto trading: 80/20 rule, AI tools, Bitcoin at $95K, and risk lessons from the track.

Morning Report | Amazon increases investment in Anthropic up to $25 billion; SEC plans to introduce an "innovation exemption" mechanism to support compliant on-chain trading of tokenized securities

Jeff Hoffman, founder of Booking.com: How Web3 and AI are reshaping the trillion-dollar social travel market

Top 12 Cryptocurrencies to Invest in April 2026
Key Takeaways: Bitcoin remains the dominant player with a $1.42 trillion market cap. Hyperliquid’s HYPE token gains traction,…
18 Best Crypto & Bitcoin Casinos in March 2026
Key Takeaways: Cryptocurrencies offer faster, cheaper, and more private payment options in online casinos. Top crypto casinos include…

Full Post-Mortem of the KelpDAO Incident: Why Did Aave, Which Was Not Compromised, End Up in Crisis Situation?
Key Takeaways: The KelpDAO incident exposed vulnerabilities in collateral pricing and cross-chain bridge operations, affecting Aave’s liquidity. rsETH…

Is MicroStrategy’s STRC Bitcoin’s Savior or Destroyer?
Key Takeaways: MicroStrategy’s STRC offers an annualized yield of 11.5%, driving significant Bitcoin buying pressure. Michael Saylor’s financial…

Ceasefire Expiration and Market Response: Bitcoin Defies Market Trends
Key Takeaways: The current ceasefire agreement is anticipated to expire on Wednesday in Washington, with low likelihood of…

Oil Price Dilemma: More Than a Price Hike
Key Takeaways: Global oil market has surpassed its breaking point, not solving with price hikes but facing significant…

On the Day Aave Launched rsETH, Spark Strategically Exited
Key Takeaways: Aave enabled rsETH lending at a 93% LTV, while Spark withdrew due to low utilization by…

Nasdaq Breaks Record and Crypto Transactions Surge
Key Takeaways: Nasdaq’s rise to a new intraday high indicates strong market momentum. A significant transfer of 35,000…

Powell: Fed Requires a Brand New Inflation Blueprint
Key Takeaways: Powell aims for transformative policy overhauls within the Fed if appointed. Past inflation response mistakes during…

Without Cook’s Apple, Can it Still Grow in the AI Era?
Key Takeaways: John Ternus acts more like a systematic integrator within Apple rather than a solo visionary. Apple’s…

Iran Stock Market and Crypto Developments in Focus
Key Takeaways: The Iranian stock market is set to reopen in 10 to 12 days, excluding companies impacted…
Gate founder Dr. Han: The crypto winter drives structural reshaping, and everything on-chain will become a new paradigm in finance
Is XRP a Good Investment in 2026? Why Is It Stuck at $1.45
XRP is up 6.7% this week, but exchange reserves remain high. Is a volatility spike imminent? We analyze price trend, ETF inflows, whale activity, and regulatory catalysts to answer: will XRP go up, why is XRP dropping, and is XRP a good investment right now?
TL; DR
What is XRP: XRP is a digital asset built for fast, low-cost international payments. It runs on the XRP Ledger and is used by Ripple for its On-Demand Liquidity (ODL) service. Unlike Bitcoin, XRP settles transactions in 3-5 seconds with near-zero fees.Why is XRP Dropping: XRP is not actively dropping, but it is struggling to rise. On the monthly chart, XRP has seen six consecutive months of decline. Currently, the price faces an additional supply wall at $1.45. About 1.24 billion XRP were bought in that range, and those holders sell when the price approaches, creating selling pressure that prevents a recovery.Will XRP Go Up: Potentially yes. XRP is trading near $1.43 and showing its best weekly performance since September 2025. If the price breaks above the $1.45 resistance, analysts expect a move toward $1.90, supported by strong institutional demand.Is XRP a Good Investment: The answer is not simple. Short-term traders may see opportunity in the coming volatility spike. Long-term investors face a bigger question that depends on one key regulatory event. However, the data reveals a surprising signal that most retail buyers are missing right now. To understand whether XRP is a smart buy or a trap at $1.43, you will need to read the full analysis below.What is XRP? A Digital Asset for Global SettlementBefore analyzing the charts, it is crucial to understand the asset in question. What is XRP? Unlike Bitcoin, which was designed as a decentralized digital gold, XRP operates on the XRP Ledger (XRPL). It was created to facilitate fast, low-cost international payments. Traditional bank transfers take days and incur high fees. XRP transactions settle in 3-5 seconds, costing fractions of a penny.
Ripple, the company associated with XRP, uses this asset for its "On-Demand Liquidity" (ODL) service. Banks and financial institutions use ODL to source liquidity during cross-border transactions without pre-funding accounts. This utility is the primary driver for institutional interest. Recently, the network hit a milestone of over 8 million active wallets, signaling growing usage despite recent price stagnation . Furthermore, Ripple is proactively preparing for the future, releasing a four-stage roadmap to make the XRPL "quantum-resistant," aiming to secure the ledger against future quantum computing threats by 2028 .
XRP Price Analysis: The Battle for $1.45The XRP price trend over the last month tells a story of exhaustion followed by cautious recovery. On the monthly chart, XRP experienced six consecutive months of decline. However, April shows signs of a bottoming process. Weekly charts reinforce this view: after four weeks of lower closes, the last two weeks have seen small rebounds.
According to data from April 22, 2026, XRP is trading at approximately $1.44. Over the last seven days, XRP has outperformed both Bitcoin and Ethereum, rising 6.7% while the broader market rose only 3.2%. Spot trading volume surged 23% to $3.79 billion, and derivative markets saw $40 billion in futures volume on a single day.
Despite this, the price remains 60% below its July 2025 high of $3.65. The current technical picture shows a "low volatility grind" higher. The 20-day EMA is at $1.3924, and the 50-day EMA is at $1.4119, both acting as support . However, the immediate hurdle is the $1.45 resistance level. This price point has rejected every rally attempt in 2026.
Why is XRP Dropping? And Will XRP Go Up?The primary reason for the recent "drop" (or lack of upward momentum) is not active selling, but rather the "supply wall." Data indicates that roughly 1.24 billion XRP tokens were purchased by investors in the $1.45 to $1.47 range. These investors have been waiting months to "break even." Every time the price approaches $1.45, these holders sell to exit their positions, creating a massive wall that retail buying cannot easily absorb.
However, the underlying momentum is shifting. Analysts suggest a xrp volatility spike imminent because the absorption capacity of buyers is increasing. Historically, when exchange reserves are high but the price refuses to drop significantly, it signals that buyers are absorbing the supply. The price has held above $1.39 despite the overhang, which is a sign of relative strength.
So, will XRP go up? Yes, potentially. But it needs a catalyst, if the price closes a daily candle above $1.45. If that happens, the next targets are $1.60 to $1.65, and eventually $1.90 .
XRP Exchange Netflow and XRP ETF Netflow: A Tale of Two MarketsThe current market dynamic is best understood by looking at two opposing data streams: XRP Exchange netflow and XRP ETF flows.
Exchange Dynamics (Retail / Whales):
Data shows a complex pattern of "large inflows and increasing reserves." Recently, a Ripple-associated wallet moved 75 million XRP (approx. $108 million) to Coinbase. This initially looks like a dump, but context matters. These transfers are likely to provide liquidity for Ripple’s ODL business, not necessarily spot market selling. However, the result is that exchange reserves have climbed to 2.76 billion XRP .
The Good News: While reserves are high, the rate of increase is slowing. Specifically, "whale" transfers to exchanges have dropped 98% from their April 11 peak. The Binance reserve has slightly decreased from 27.7 to 27.6 billion. The aggressive selling from large holders appears to have stopped.
Institutional Dynamics (ETF):
While whales were sending coins to exchanges, institutions were buying XRP ETF products. XRP ETF net flow is strongly positive.
US-listed XRP ETFs recorded four consecutive days of inflows totaling $38.86 million recently .The weekly inflow for mid-April hit $119.6 million, a multi-month high .Cumulative net inflows stand at $12.8 billion, with Assets Under Management (AUM) at roughly $10.8 billion.Analyzing the Divergence: Why Both Flows Are PositiveIt seems contradictory that exchange reserves are high (suggesting selling) while ETFs are buying (suggesting buying). However, this phenomenon reveals the current market structure.
Different Investor Profiles: The exchange inflows likely come from short-term traders, market makers, or Ripple itself providing ODL liquidity. These are "hot" coins ready to be sold. The ETF inflows represent "sticky" capital. Institutions buying ETFs are typically long-term holders (LTHs) or asset managers who do not day-trade. They are removing liquidity from the spot market by buying through custodians.The "De-risking" Trade: Sophisticated funds might be engaging in basis trading. They buy the ETF (taking a long position) while simultaneously shorting XRP futures or selling spot inventory to capture the funding rate. This keeps the price stable while volume increases.Absorption: The most likely scenario is that the market is simply absorbing the excess supply. The fact that the price is stable ($1.43) and not collapsing to $1.20 despite 2.76 billion coins sitting on exchanges is a massive win for the bulls. The ETF inflows are acting as a sponge, soaking up the selling pressure from the ODL wallets.The Regulatory Catalyst: The SEC and the CLARITY ActFundamentally, the recent price action cannot be separated from regulation. For years, the primary answer was the SEC lawsuit. That narrative is dying.
Ripple CEO Brad Garlinghouse recently praised SEC Chair Paul Atkins as "a breath of fresh air and sanity" . This regulatory thaw is critical. The SEC is reportedly considering dropping the long-standing lawsuit, and five XRP ETF applications are awaiting review.
The major catalyst on the horizon is the CLARITY Act. A Senate markup is expected before the end of April. Standard Chartered analysts project that if the bill advances, it could unlock $4 to $8 billion in institutional flows . Polymarket gives the bill a 60-66% chance of passing in 2026. If the CLARITY Act classifies XRP as a non-security (commodity), the institutional floodgates will open, likely overwhelming the $1.45 supply wall instantly.
Is XRP a Good Investment in 2026?Given all this data, is XRP a good investment? The answer depends entirely on your risk tolerance and time horizon.
The Bull Case (Why it is a good investment): The risk/reward ratio is asymmetrical to the upside. The price is near multi-year lows relative to its utility. Whale selling has stopped, ETF demand is rising, and the network is expanding (8 million wallets, quantum resistance roadmap). If the CLARITY Act passes, XRP could realistically trade between $1.60 and $1.80 in the short term, with a potential run to $3.00+ if the lawsuit is officially dropped.The Risk Case (Why it is NOT a good investment): There is a clear resistance wall at $1.45. If the CLARITY Act fails or is delayed past May (due to midterm election dynamics), the "buy the rumor, sell the news" dynamic could reverse. If the price fails to break $1.45 and loses support at $1.33, a drop back to $1.15 is technically possible .Verdict: XRP is a speculative buy for traders looking for a volatility spike. It is a hold for current investors. For new investors, it is only a good investment if you believe in regulatory clarity within the next 30 days. Technically, waiting for a confirmed break above $1.55 (to avoid the fakeout) is safer than buying at $1.43.
FAQQ: Will XRP go up if the CLARITY Act passes?
A: Yes, historically. Analysts predict that if the CLARITY Act passes, signaling that XRP is a commodity, it would remove the regulatory overhang. This could trigger a surge in institutional buying, pushing the price from the current $1.43 range to test the $1.80 - $2.00 resistance levels quickly.
Q: Why is XRP dropping when Bitcoin is going up?
A: XRP has specific supply dynamics. Unlike Bitcoin, which has a fixed supply issuance, XRP faces periodic sell-pressure from Ripple's treasury wallets used to fund ODL (liquidity) services. Additionally, the $1.45 "break-even" wall causes XRP to drop relative to BTC when short-term traders exit.
Q: Is a volatility spike imminent for XRP?
A: Yes. The Bollinger Bands on the daily chart are squeezing. The price is stuck between support at $1.33 and resistance at $1.45. Historically, when XRP volume surges 23% in a week (as it did on April 21), it precedes a violent move. The direction depends on whether the $1.45 resistance breaks.
Q: What is the XRP ETF netflow status?
A: As of late April 2026, XRP ETFs are seeing positive netflows. The US ETFs recorded a single week inflow of $119.6 million in mid-April. Cumulative inflows are strong at $12.8 billion, indicating that institutions are accumulating during this dip, which is a long-term bullish signal for price stabilization.
Q: Is XRP a good investment for beginners?
A: XRP is less volatile than "meme coins" but more volatile than Bitcoin. For beginners, it is a moderate-risk investment. Its value is tied to real utility (bank payments). However, beginners should wait to see if the price can close a weekly candle above $1.55 before entering, to avoid buying into the current resistance wall.
Disclaimer: None of the information in this article constitutes, or is intended to constitute, investment advice. Trading cryptocurrencies carries a high level of risk and may not be suitable for all investors. Always do your own research.
About WEEXFounded in 2018, WEEX has developed into a global crypto exchange with over 6.2 million users across more than 150 countries. The platform emphasizes security, liquidity, and usability, providing over 1,200 spot trading pairs and offering up to 400x leverage in crypto futures trading. In addition to the traditional spot and derivatives markets, WEEX is expanding rapidly in the AI era — delivering real-time AI news, empowering users with AI trading tools, and exploring innovative trade-to-earn models that make intelligent trading more accessible to everyone. Its 1,000 BTC Protection Fund further strengthens asset safety and transparency, while features such as copy trading and advanced trading tools allow users to follow professional traders and experience a more efficient, intelligent trading journey.
Follow WEEX on social mediaX: @WEEX_Official
Instagram: @WEEX Exchange
Tiktok: @weex_global
Youtube: @WEEX_Official
Discord: WEEX Community
Telegram: WeexGlobal Group
FC Barcelona vs Celta Vigo: Can Anyone Stop Barcelona at Home?
FC Barcelona vs Celta Vigo lineups, standings, and stats for April 22, 2026. FC Barcelona need a win to stay on track for the La Liga title. Full preview inside.
Carl Moon & WEEX Head to Mugello: The Crypto Trader's Ferrari Challenge
Forget the sidelines. WEEX is hitting the 300km/h mark at Mugello this weekend. Witness Carl Moon’s transformation from a supermarket cashier to a Ferrari racer, and discover why the world’s fastest trading floor belongs on the world’s most technical track at the official Ferrari Challenge.
How to Become a Pro Crypto Trader: WEEX Interview with Ferrari Racer Carl Moon
Ferrari racer Carl Moon on mastering crypto trading: 80/20 rule, AI tools, Bitcoin at $95K, and risk lessons from the track.
