- Buy Crypto
- Markets
 Futures
- Spot
- Copy Trade
- Earn
- More
On-chain Data Academy (Part 1): Do you know what the average market-wide BTC cost is?
Original Article Title: "On-Chain Data School (Part 1): Do You Know What the Market-Wide BTC Average Cost Is?"
Original Article Author: Mr. Berg, On-Chain Data Analyst
TLDR
· This article will introduce "one on-chain analysis concept" and "three on-chain data points"
· MVRV represents the market-wide profit state
· Realized Price represents the average cost of holding BTC for the entire market
· Realized Cap can be thought of as "how much money the market collectively spent to buy BTC"
What Is Realized Cap?
Realized Cap, also known as Realized Market Cap, refers to "multiplying each unit of BTC by the price at the last transfer, and then summing them up".
In simple terms: Each transfer can be seen as a "transaction", so multiplying the corresponding amount of BTC by the price at the last transfer is equivalent to the cost of that transaction. Adding up these costs gives you the Realized Cap.
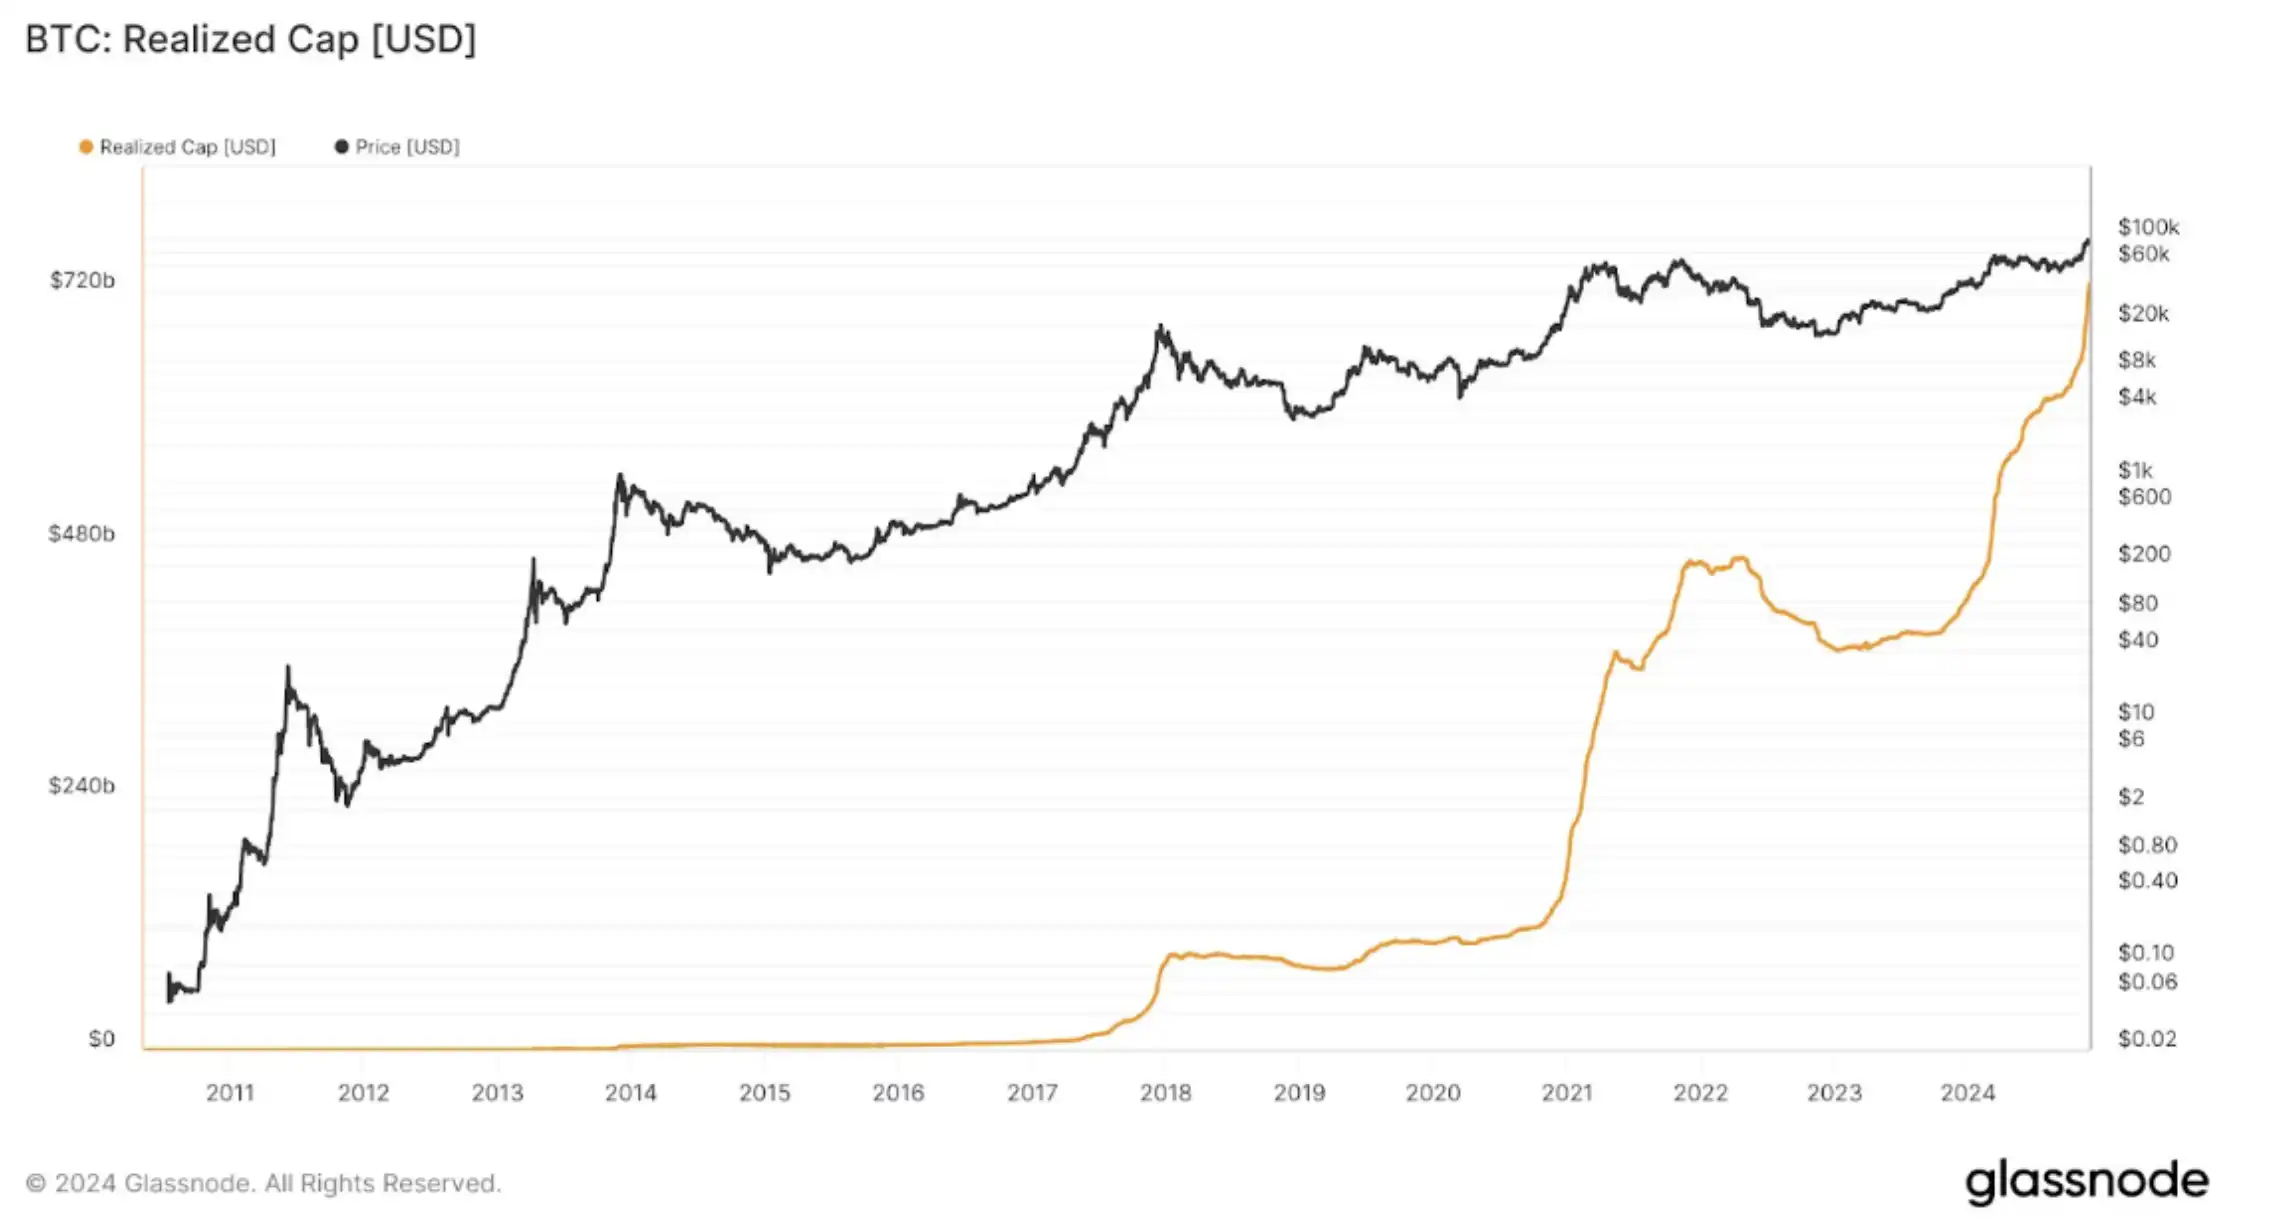
Realized Cap Chart
What Is Realized Price?
Realized Price (RP), also known as Realized Price, is the number obtained by dividing "Realized Cap by the current BTC circulating supply".
We can interpret this as: "Total cost of BTC purchased by the whole market / How many BTC were purchased".
In other words, this is the "average cost of BTC for the entire market". By the way, it's always a good buying opportunity when the price is below RP!

Realized Price Chart

(Price Below Realized Price)
What Is MVRV?
MVRV, short for MV divided by RV, represents the market's profitability status.
MV refers to the current BTC market value, i.e., "market price x circulating supply"; while RV is Realized Cap.
Moreover, if both the numerator and denominator of the formula are divided by the circulating supply, MVRV can also be expressed as "market price / RP." For example: if MVRV = 2, it represents an average market profitability of 100%.

MVRV Chart
Summary
The above is all the content of On-Chain Data School (Part One). For readers interested in delving deeper into on-chain data analysis, remember to track this series of articles!
If you want to see more analysis and educational content on on-chain data, feel free to follow my Twitter (X) account!
Hope this article has been helpful to you. Thank you for reading.
You may also like

Trading Never Sleeps: On-Chain, Crude Oil, and Leverage

On-chain Yield Panorama: The Evolution from Interest-bearing Stablecoins to Crypto Credit Products

RootData announced the integration with OpenClaw, and these gameplay features have gone viral

Key Market Intelligence on March 9th, how much did you miss out on?

a16z: After AI Superpowers, Where to Next for Humanity?

Why Does Oil Go Up When Bitcoin Goes Down?

Decoding 112,000 Polymarket Addresses: The Top 1% Making Money Are Doing These Five Things

AAVE founder issues a warning: DeFi must never become the exit liquidity for Wall Street private credit

How To Create A Frequency So Strong It Makes Reality Obey You
The first-ever WEEX AI Hackathon has concluded, with 10 winners emerging from over 200 global teams. Beyond its $1.8 million prize pool, the event marked a milestone—proving that the future of AI trading belongs to accessible, AI-powered innovation.

The cryptocurrency industry has waited for five and a half years, and what they got is half a ticket

The trend of Ethena reveals what information about the cryptocurrency market

I've been in the crypto industry for five and a half years, and all I got was half a ticket.

Crude Oil Surges 25%, Hyperliquid Unfolds On-Chain Showdown

$20 Billion Valuation, Is Kalshi Engaging in an Arms Race with Polymarket?

Will Not Messing with OpenClaw Lead to Obsolescence in the AI Era? | Lobster Fuss Summit

Anticipating the Market's New Challenge to Political Elections

The Shadow Business Empire of Iran's New Supreme Leader: Oil, Real Estate, and Financial Intrigue
