 Buy Crypto
- Markets
 Futures
- Spot
- Copy Trade
- Earn
- More
L1 Value Capture Shrinks Significantly, ETH, SOL, HYPE Struggle to Return to All-Time High


Original Title: The Compression of L1 Value Capture
Original Source: Pine Analytics
Original Translation: Ethan, Odaily Planet Daily
Editor's Note: In the past few years, the crypto market has once believed that the transaction fee revenue of Layer 1 blockchains is the core cash flow supporting token valuation. However, this study used on-chain data to uncover a different fact: whether it's Bitcoin's congestion cycles, Ethereum's DeFi and NFT peaks, or Solana's memecoin frenzy, all transaction fee booms will eventually be compressed by innovation. Demand surges bring income peaks, and these peaks stimulate alternative solutions to emerge, causing profits to be systematically squeezed out. The compression of L1 value capture is not a cyclical phenomenon but a structural outcome of open networks.
By 2026, the market no longer simply values L1 based on "fee capture." The price driving forces of ETH and SOL are shifting from L1 fee logic to staking rewards, ETF capital flows, RWA narratives, protocol upgrade expectations, and the macro liquidity environment. The compression trend continues, but the pricing anchor has already shifted. What is truly worth considering is not just whether transaction fees will continue to decline but rather: when the market no longer prices L1 based on "on-chain profits" but instead uses "asset narratives" and "structural capital flows" for pricing, whether this new logic is equally fragile; and when the narrative fades, what kind of fundamental support the price will return to.
L1 blockchains, in their stage of scaling development, find it challenging to continuously and stably earn transaction fees. Every major income source they once identified—from transaction fees to MEV—will eventually be eroded bit by bit by the users they serve through various arbitrage methods. This is not because a particular chain did not perform well but rather due to the inherent nature of open, permissionless networks: as soon as the money L1 earns from fees reaches a certain scale, transaction stakeholders will find new ways to compress this income or even reduce it to zero.
Bitcoin, Ethereum, and Solana are considered some of the most successful networks in the crypto space. Interestingly, despite processing billions of dollars in value flow every day, these three have followed almost the same path: transaction fee revenue suddenly surges in the short term, attracting everyone's attention, but before long, it is seized by L2 (layer 2 networks), private order flows, MEV-aware routing tools, or new gameplay at the application layer. This situation has repeatedly occurred in every transaction fee model in the crypto industry, every MEV fluctuation cycle, and every scaling solution, with no signs of slowing down.
This article argues that L1 transaction fees being compressed is a long-standing and accelerating trend. This article will outline the specific innovative plays that can compress profits at different stages, and also explore what this means for L1 tokens that still factor "earning sustainable revenue through transaction fees" into their valuation.
Bitcoin
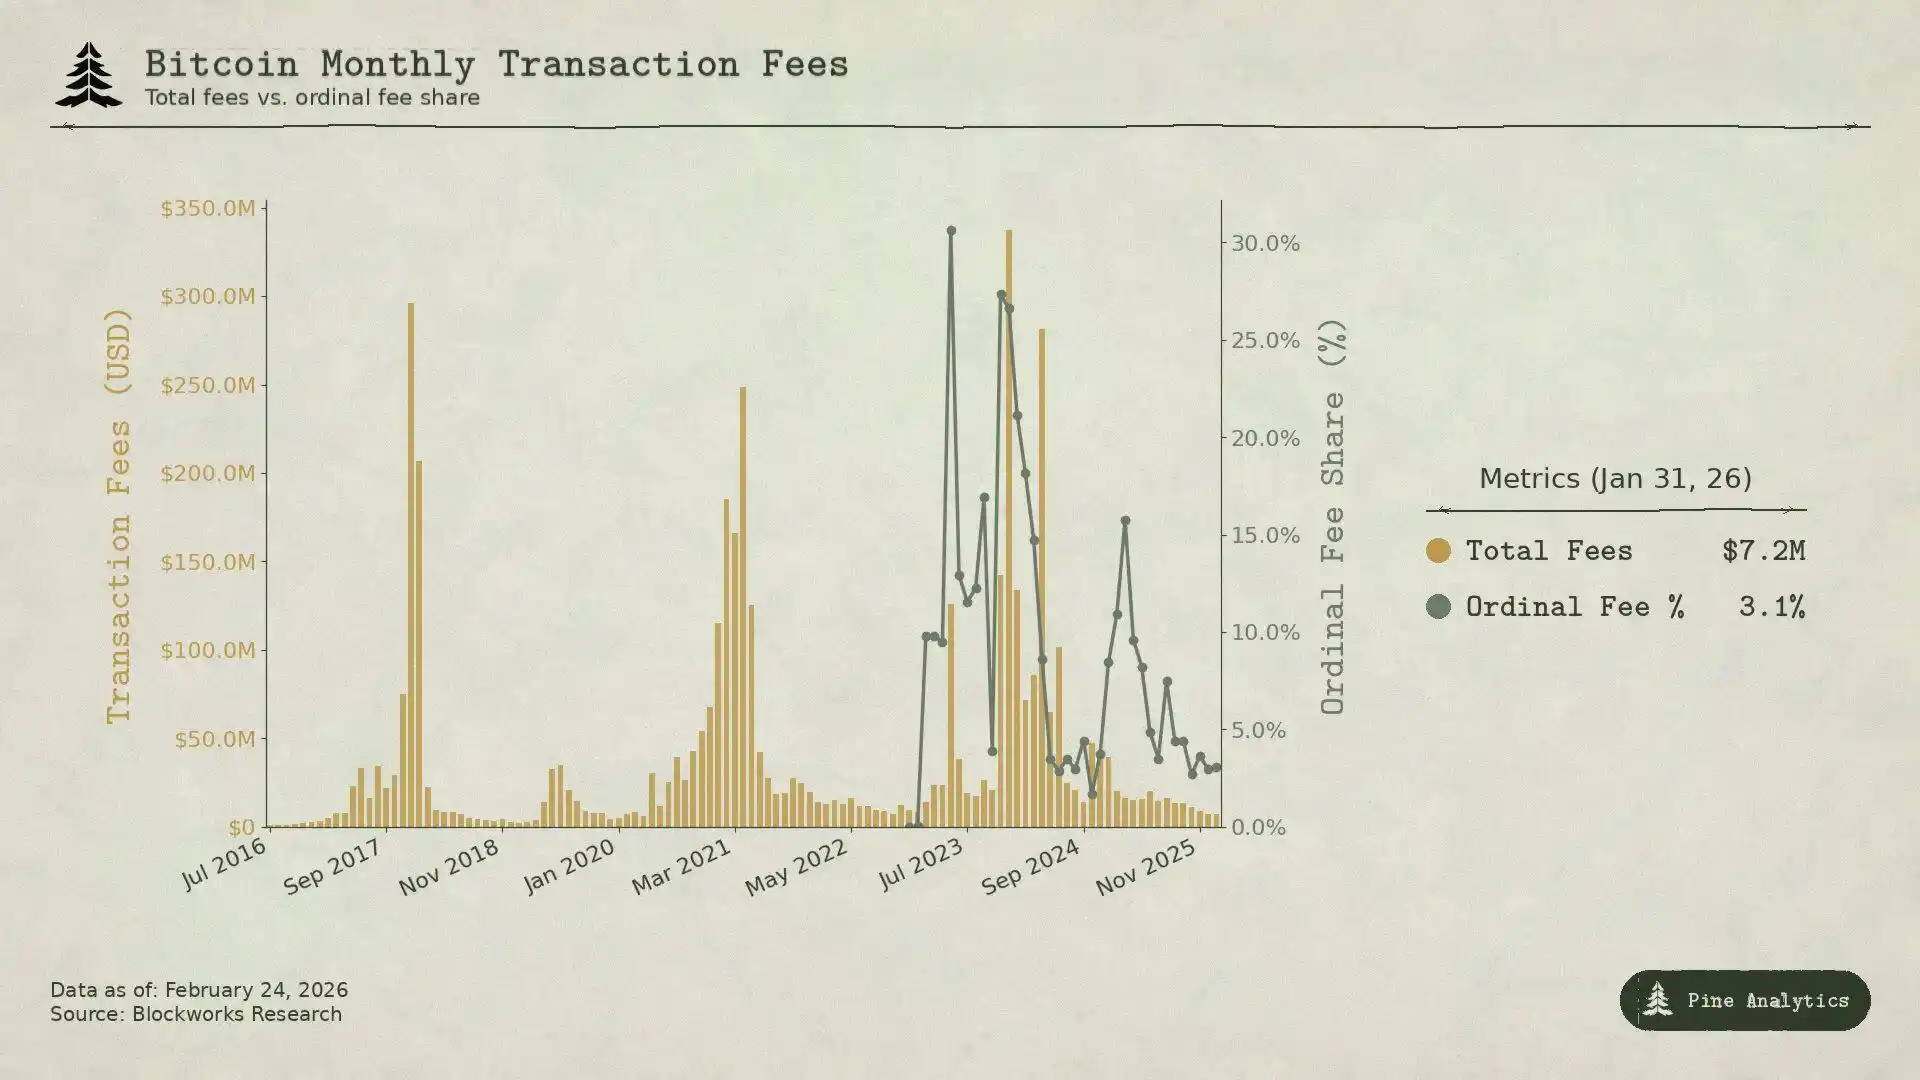
Bitcoin's transaction fees heavily rely on on-chain congestion during BTC transfers to earn fees—everyone rushes to make transfers, naturally driving up fees. Additionally, because Bitcoin doesn't have smart contracts, there is almost no such thing as MEV on the network. The key issue is this: whenever BTC price surges and transaction fees spike, the fee increase relative to the economic activity at that time is much weaker compared to the previous cycle.
Back in 2017, when BTC surged from $4,000 to $20,000, the average fee skyrocketed from less than $0.40 to over $50. At the peak on December 22, fees accounted for 78% of the miner block reward: fees alone were around 7,268 BTC, nearly four times the block subsidy. Yet, in just three months, fees plummeted by 97%, reverting to their original state.
The market responded exceptionally fast and solutions emerged quickly. In early 2018, SegWit transactions only accounted for 9%, growing to 36% by mid-year; though these transactions represented over a third of the total volume, they contributed only 16% of the fees. Exchanges also started batch processing, consolidating hundreds of withdrawals into a single transaction, saving a significant amount of fees. With these factors combined, fees dropped by 98% in six months. Additionally, the Lightning Network officially launched in early 2018 to address the fee issue with small transactions, and other on-chain Wrapped BTC solutions allowed users to hold BTC exposure without needing to operate on the Bitcoin main chain.
By the peak of BTC's price in 2021, despite the price reaching $64,000, monthly fee income was even lower than in 2017. At that time, there were fewer on-chain transactions, but the dollar-denominated transfer volume was 2.6 times higher than in 2017—simply put, there were more network transfers, but the fees that could be earned did not keep up, and even decreased.
In the current cycle, this trend is even more evident. With BTC rising from $25,000 to over $100,000, an increase of roughly 3x (the original text says 4x, adjusted slightly to reflect the actual price range without changing the original intent), standard transfer fees have never experienced the same explosive growth as in previous cycles. By the end of 2025, daily transaction fees will be approximately $300,000, which is less than 1% of total miner revenue. In 2024, Bitcoin's annual transaction fees amounted to $922 million, but most of it came from the short-term hype around Ordinals and Runes, not stable revenue from traditional BTC transfers. By mid-2025, mainstream Bitcoin ETFs already hold over 1.29 million BTC, about 6% of the total supply, providing the market with considerable BTC exposure demand, yet generating no on-chain transaction fees. The on-chain interactions needed to acquire Bitcoin assets have been largely engineered out.
Ordinals and Runes once in April 2024 pushed the fee-to-miner ratio to 50% of the block reward, but as related tools matured, by mid-2025, this ratio had dropped back to below 1%. This short-term spike was more reminiscent of MEV windfalls rather than stable income from congestion, driven by immature tooling around new assets rather than genuine demand for BTC settlement.
This pattern is actually quite clear: whenever Bitcoin makes enough visible money from fees, cheaper alternatives emerge in the ecosystem. L1 can only earn one short-term fee peak from each use case, with subsequent profit continuously eroded by innovation.
Ethereum
Ethereum's fee story is even more dramatic. This chain truly captured massive value, only to witness it being systematically dismantled.
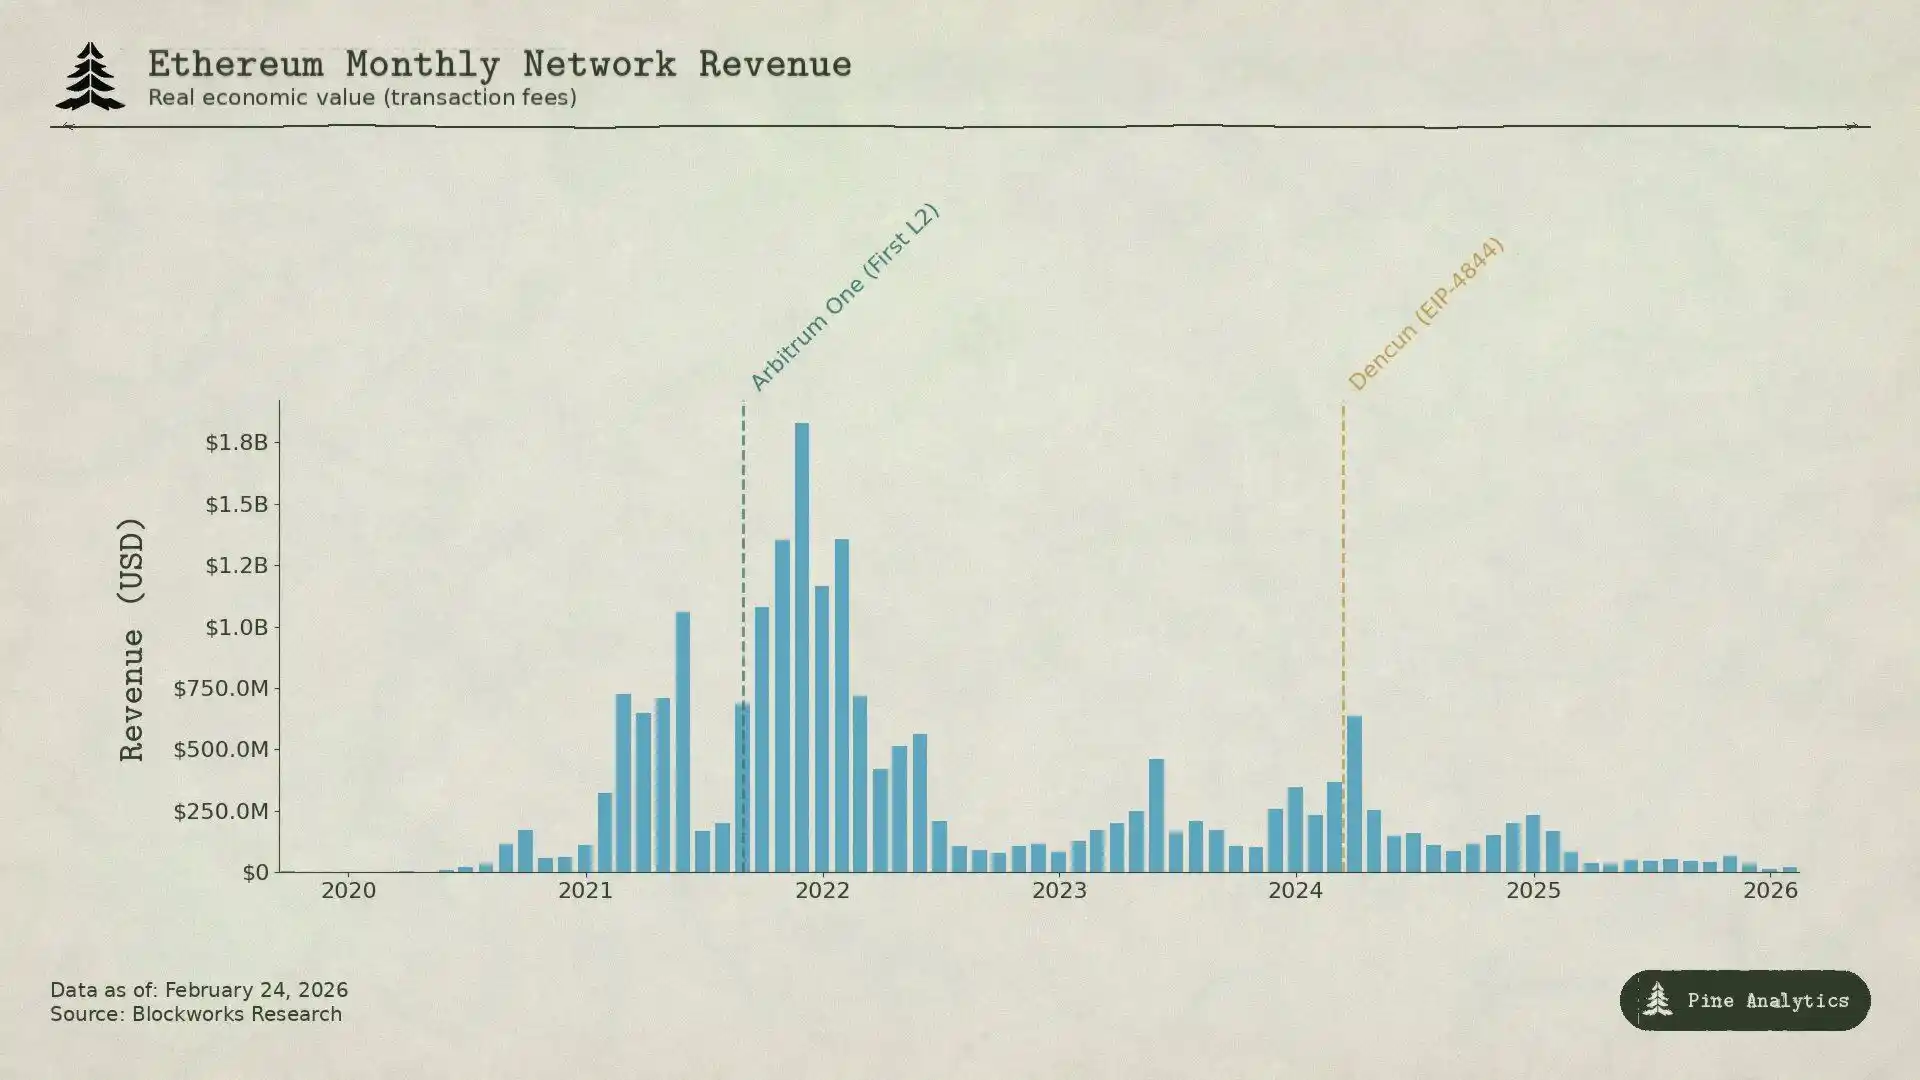
In mid-2020, 'DeFi Summer' positioned Ethereum as the epicenter of the new financial system. Uniswap's monthly volume surged from $169 million in April to $15 billion in September. TVL grew from under $1 billion to $150 billion by year-end. In September 2020, Ethereum miners hit a record $166 million in fee revenue, six times that of Bitcoin miners. This was also the first time a smart contract platform earned sustained and substantial income from real economic activity.
In 2021, NFTs layered on top of DeFi. Average transaction fees peaked at $53. Quarterly fee revenue increased from $231 million in Q4 2020 to $4.3 billion in Q4 2021, a growth of 1,777%. EIP-1559, implemented in August 2021, introduced a base fee burn mechanism, permanently removing some fees from circulation. At that time, Ethereum seemed to have truly addressed the core issue of L1 not making money.
However, these fees are essentially 'congestion fees': users pay $20 to $50 transaction fees not because the transaction itself is worth that much, but because everyone is trying to use the chain, exceeding Ethereum's processing capacity of roughly 15 transactions per second (15 TPS). This inherent limitation has also provided ample room for cheaper alternatives.
Other L1s like Solana, Avalanche, BNB Chain can provide transaction services for just a few cents; Ethereum's L2 Rollups, such as Arbitrum and Optimism, have captured a good amount of business—they process transactions on their own networks, then batch the compressed transactions back to the Ethereum mainnet for settlement, fast and cheap.
Subsequently, Ethereum underwent a "self-nerf." The Dencun upgrade on March 13, 2024, introduced Blob transactions (EIP-4844), providing a cheaper data publishing path for Layer 2. Prior to this, L2 used calldata, costing around $1,000 per megabyte. Post-upgrade, Arbitrum's single transaction fee dropped from $0.37 to $0.012, and Optimism's from $0.32 to $0.009. The median fee in Blob almost dropped to zero. Ethereum initially hoped to retain users with this but unexpectedly weakened its last significant fee revenue source.
Looking at the data makes it more intuitive. In 2024, L2 generated $277 million in revenue but only paid around $113 million to Ethereum. By 2025, L2 revenue had dropped to $129 million, with a flowback to Ethereum of only about $10 million, less than 10% of L2 revenue, a year-on-year drop of over 90%. The once over $100 million monthly L1 fee revenue had plummeted to below $15 million in the fourth quarter of 2025. This chain that generated $4.3 billion in revenue in a single quarter saw its revenue shrink by about 95% just four years later.
Bitcoin's revenue was compressed because people could get BTC off-chain; Ethereum's revenue was compressed in two waves:
The first wave was other alternative networks, which attracted users who did not want to spend high congestion fees;
The second wave was Ethereum's own scaling plan, which reduced the cost of L2 transmitting data to almost zero, and Ethereum itself could no longer make money through settlements. Regardless of which kind, L1 either built or allowed those tools that took away its revenue to appear.
Solana
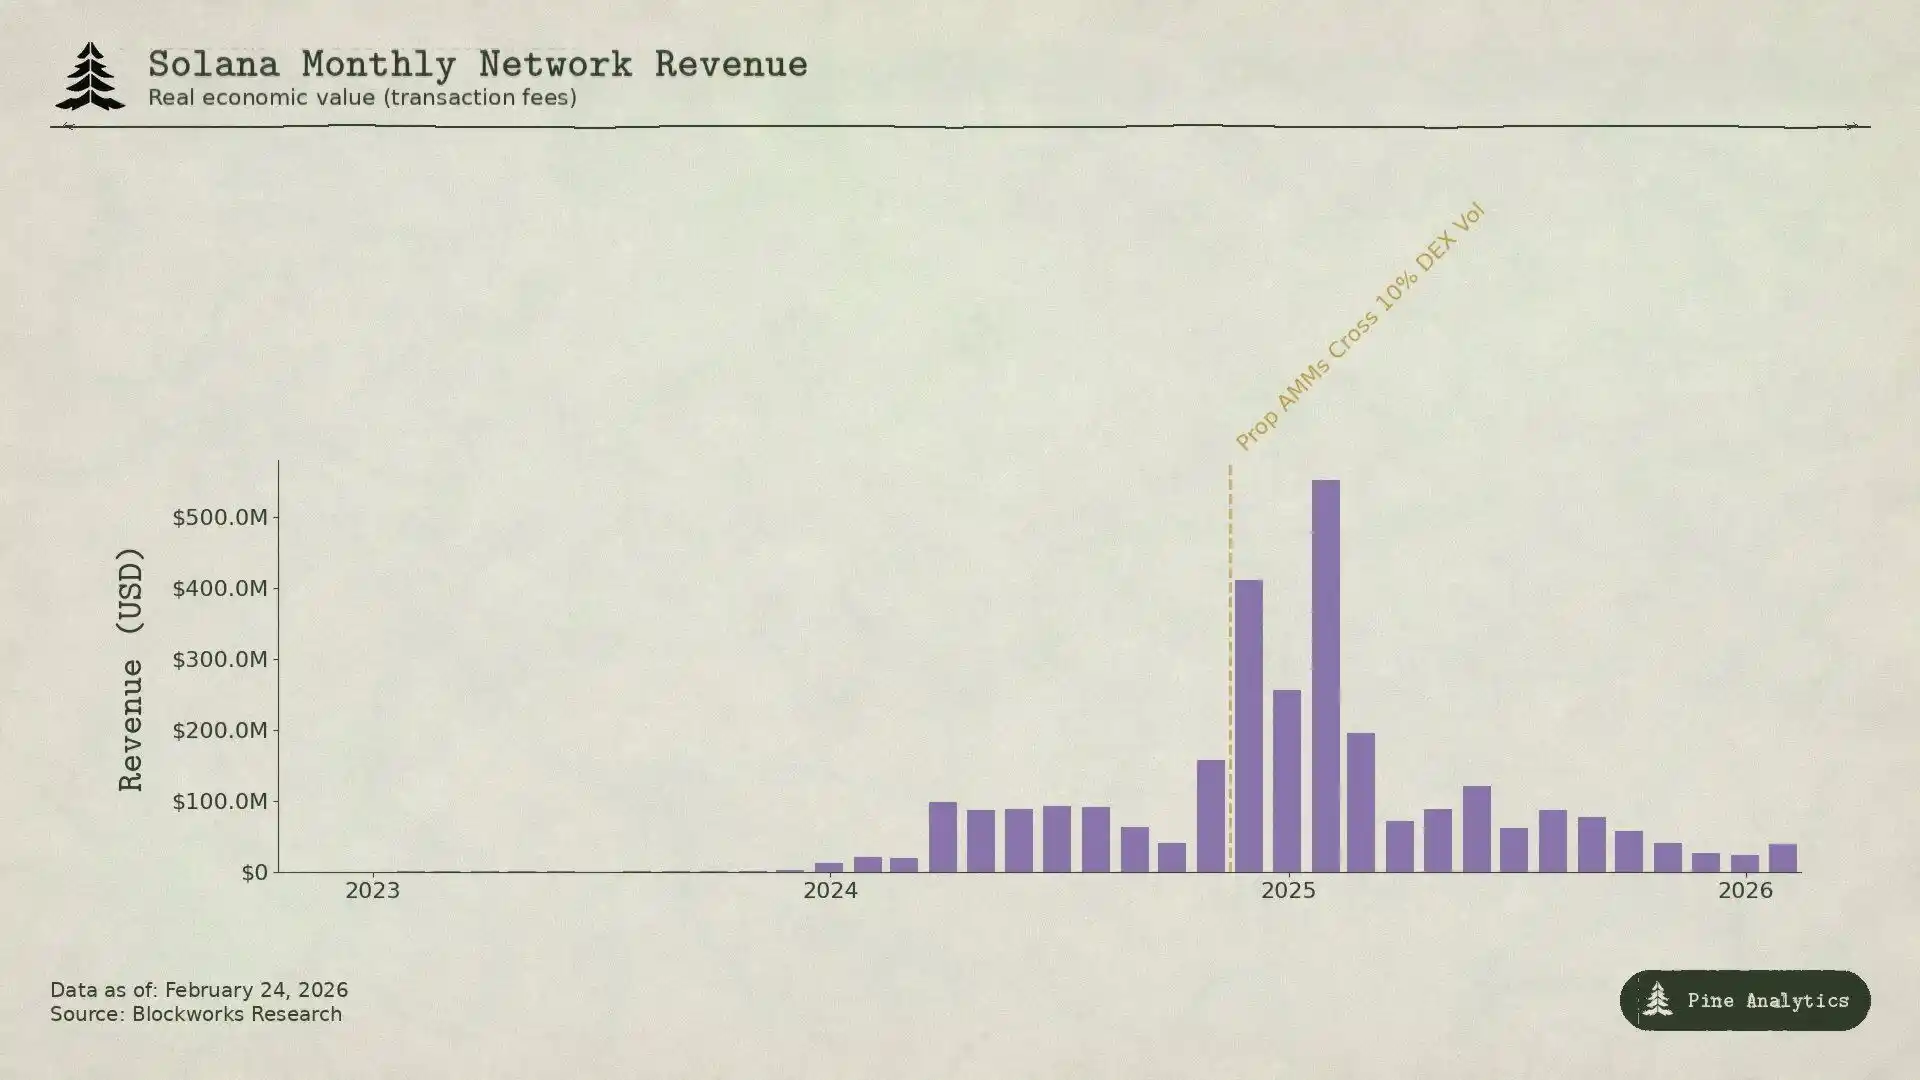
The logic behind Solana's revenue generation is completely different from Bitcoin and Ethereum—it hardly relies on congestion to earn fees. The base fee is fixed at 0.000005 SOL per signature, so cheap that it can almost be ignored. About 95% of the fee revenue comes from priority fees and MEV tips paid through the Jito block engine. In the first quarter of 2025, Solana's Real Economic Value (REV) reached $816 million, with 55% coming from MEV tips. In 2024, validators could earn around $1.2 billion, with operational costs of only about $70 million, leaving significant profit margins.
The key driver of the Solana fee explosion was memecoin trading. Pump.fun, launched in January 2024, generated over $6 billion in protocol revenue in less than 18 months, with memecoin issuance peaking at 99% during its heyday. DEX daily trading volumes once reached $380 billion. In January 2025, the TRUMP token launch sent single-day priority fees skyrocketing to 122,000 SOL, with MEV tip amounts hitting 98,120 SOL. In 2024, the top 1% of memecoin traders contributed $1.358 billion in fees, representing nearly 80% of total memecoin fees, mostly driven by MEV.
Today, two types of innovation are curtailing this revenue stream.
The first is proprietary AMMs. Protocols like HumidiFi, SolFi, Tessera, ZeroFi, GoonFi, among others, employ private treasuries managed by professional market makers, offering internal quotes updated multiple times per second. As liquidity is not publicly exposed, MEV bots cannot front-run trades. Crucially, proprietary AMMs route orders through aggregators like Jupiter, actively selecting counterparties instead of passively exposing themselves to any participant willing to pay an MEV bribe. By keeping pricing private and consistently refreshed, they eliminate the issue of "stale quotes," a major source of Solana's considerable MEV income. HumidiFi processed nearly $1 trillion in transaction volume in its first five months post-launch. Today, proprietary AMMs represent over 50% of Solana DEX trading volume, even higher in high-liquidity pairs like SOL/USDC.
The second is Hyperliquid, which directly migrates the most profitable spot trading activity off Solana. Leveraging its in-house HyperCore technology, it developed a native bridging solution allowing tokens on Solana to be deposited into and withdrawn from Hyperliquid and traded on its spot order book. When Pump.fun introduced the PUMP token in July 2025, price discovery occurred on Hyperliquid, not Solana's DEX, facilitated by the HyperCore cross-chain bridge. Prior to this, Hyperliquid had already trialed this model with SOL itself and tokens like FARTCOIN—during the phase of maximum price impact, volatility, and MEV profitability at the token's initial pricing, they had already started moving off Solana.
These two play-to-earn mechanisms squeeze Solana's revenue from both directions: The proprietary AMM reduces MEV transactions left on Solana, while Hyperliquid moves the most MEV-profitable spot trades off-chain. By the second quarter of 2025, Solana's REV decreased by 54% compared to the previous quarter, leaving only $272 million; daily MEV tip fees dropped by over 90% from the January peak, now less than 10,000 SOL per day.
In fact, the pattern is the same as the first two chains, just the way of making money is different:
Solana's fees are essentially short-term money earned through MEV when the new transaction gameplay first emerged, and things were still relatively chaotic. Once the proprietary AMM optimized transaction efficiency and Hyperliquid siphoned off high-value orders, this profit quickly shrank. While L1 can make a significant profit during market frenzy, the market will quickly find new ways to prevent this short-term gain from continuing indefinitely.
Impact on Token Prices
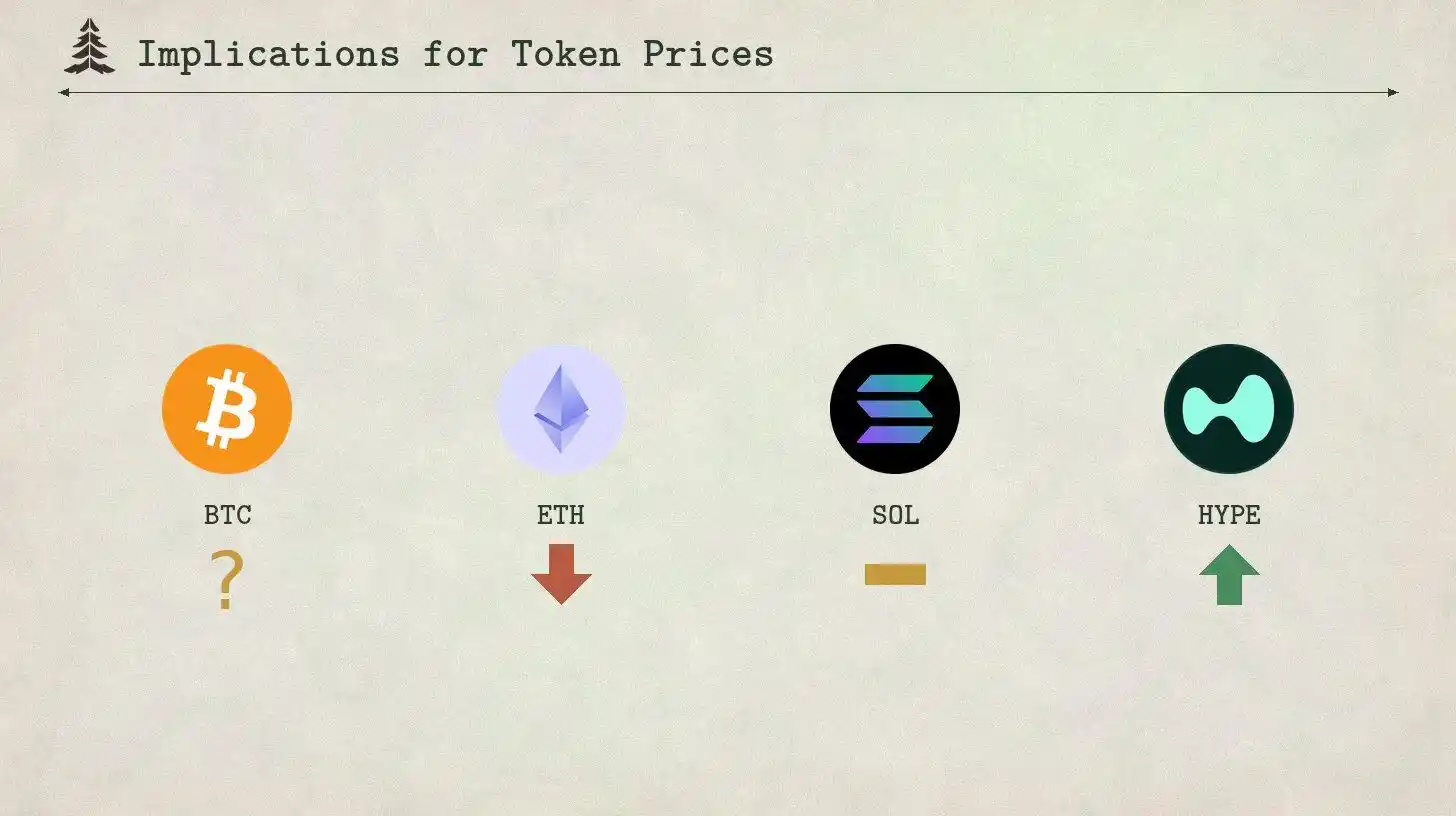
The pattern exhibited by the three chains mentioned above is not just a retrospective description; to some extent, it also has foresight. Every L1 fee mechanism follows the same trajectory: new demand brings peak revenue, the peak attracts innovation, innovation compresses profits, and once this compression occurs, it is challenging to reverse. Following this line of thought, we can have a rough judgment on the future of the four tokens.
· Ethereum: Sustained fee "collapse"
Ethereum's fees have not yet seen a clear bottom. In 2024, L2 contributed $113 million to the Ethereum mainnet; by 2025, it plummeted to around $10 million, a decrease of over 90%. With each new L2, the demand for Ethereum mainnet block space decreases, and Ethereum's own scaling plans continue to lower the cost of data transmission. EIP-4844 is not a one-time repricing but a structural shift—Ethereum is proactively diverting activity away from its fee market to infrastructure tools outside it.
Currently, monthly L1 fee revenue has dropped below $15 million, and the forces driving the decline are still strengthening. If Ethereum cannot create entirely new L1 native demand sources, the token price will continue to reflect this compression trend. ETH is increasingly resembling a low-yield infrastructure asset rather than the high-growth smart contract platform it once was.
· Solana: Peak Activity Innovation, Price Not Necessarily
Solana is almost certain to set a new peak in on-chain activity in the next cycle — its ecosystem is deep enough, with plenty of developers, and its infrastructure mature enough. However, fee revenue may not rise accordingly. The meme coin frenzy from late 2024 to early 2025 was Solana's equivalent of Bitcoin's "SegWit moment": a peak in fees driven by new demand, followed by rapid compression due to innovation.
Currently, proprietary AMMs have processed over 50% of DEX trading volume, significantly mitigating MEV. Hyperliquid's HyperCore technology is even moving the most profitable pricing stages off-chain. Even if on-chain activity is 2 to 3 times higher than in January 2025, its fee system has matured to the point where it is quite challenging to translate this activity into corresponding validator revenue. Despite a drop of over 90% in daily average MEV fees from its peak, on-chain activity remains robust. Without sufficient fee revenue to support its valuation, even if Solana's adoption reaches new highs, the possibility of SOL breaking its all-time high in the next cycle is slim.
· Hyperliquid: Prosperity and Compression of the Front and Backends
Hyperliquid is the most noteworthy case as it represents the next stage of this "earn-squeeze" cycle, and the market has yet to realize how the latter part of this cycle will unfold.
Hyperliquid is now the leading decentralized exchange for traditional financial asset perpetual contract (perps) trading. During a recent silver volatility peak, the market deployed by HIP-3 captured about 2% of global silver trading volume, with the midpoint spread for retail-scale trades even outperforming COMEX. At certain times, traditional financial instruments accounted for about 30% of platform trading volume, with daily nominal trading volume exceeding $5 billion. The platform's revenue in 2025 was about $600 million, 97% of which was used for HYPE token buybacks and burns.
We expect Hyperliquid to continue dominating perpetual contract trading for TradFi assets. Its products do have advantages: commodities and stocks can be traded 24/7, even when traditional markets are closed; through the HIP-3 proposal, new trading markets can be added without approval; for assets requiring an 18% initial margin on CME, it can offer up to 20x leverage. In the next bull market, if trading volume and fees continue to rise, the HYPE token may reprice like Solana did from the bear market low point, if traditional financial asset trading volume keeps expanding, HYPE will likely follow a similar path. Investors are likely to use a single high revenue quarter to project that it will continue to earn as much in the future.
However, Hyperliquid's fee model has planted a compressed seed. The platform charges a nominal value fee of 4.5 basis points to the maker and offers up to a 40% discount based on trading volume and staking. This is in stark contrast to traditional financial derivative pricing logic. At the CME, the exchange fee for one E-mini S&P 500 contract is about $1.33 per side, unrelated to the nominal value above $275,000, equivalent to less than 0.001 basis points. For a $10 million nominal position: CME fees are about $2.50, while Hyperliquid charges $4,500, a difference of approximately 1,800 times.
This price differential exists because Hyperliquid's current user base is primarily retail and crypto-native. However, TradFi perpetual products will bring TradFi expectations. As trading volume expands and institutional participants enter, the pressure to move closer to a CME-like economic model will significantly increase. Hyperliquid's own fee structure has revealed the direction: HIP-3 growth mode will cut maker fees for new markets by over 90%, potentially as low as 0.0045%; top traders may even go below 0.0015%. The protocol is actively driving fee compression. Competitive perpetual DEXs, as well as traditional exchanges offering on-chain products in the future, will further accelerate this process.
Ultimately, there are only two outcomes: either Hyperliquid loses trading volume due to high fees, or it adjusts its fee structure to a fixed fee model similar to CME's. Either way, the long-term high revenue that investors are currently anticipating will be challenging to achieve, and the HYPE token price may also experience a rapid decline.
· Bitcoin: Price Must Rise Before Fees
Among these four assets, Bitcoin is the most unique, as its fee and token price have a reversed logic relationship. For Ethereum, Solana, and Hyperliquid, the logic is: fees generate revenue, revenue supports valuation, fees get compressed, and token prices drop. But Bitcoin is different; the logic is reversed. Miners must rely on a continuous increase in coin price to survive each block reward halving because fee revenue has been proven insufficient to make up for the reduced block subsidy.
The 2024 halving will reduce block rewards from 6.25 BTC to 3.125 BTC, and the daily issuance will drop from 900 BTC to 450 BTC. By the end of 2025, daily transaction fees will be about $300,000, accounting for less than 1% of miner revenue. Although Bitcoin's full-year fee revenue in 2024 reached $922 million, most of it came from the phase-related peaks of Ordinals and Runes, rather than sustainable natural fee demand. Current fee contributions are almost negligible, and miner revenue relies almost entirely on block subsidies, which halve every four years, based on BTC pricing. The only way miners can remain profitable during the halving cycle is if Bitcoin's USD price roughly doubles over a similar timeframe to offset the 50% reduction in BTC-denominated income.
In history, this condition has been met. However, this foundation is extremely fragile. The security budget of the chain is not funded by usage but by the continuous rise in asset price. Once at a halving event, if the coin price does not increase, mining will become unprofitable, hash rate will decrease, network security will be affected, and it may even fall into a vicious cycle of "price drop → hash rate drop → decreased security → further price drop".
This also makes Bitcoin's "sustainability" more fragile than it seems. The coin price can support network security with almost no transaction fees, a mechanism that other chains find hard to replicate, because Bitcoin is primarily an asset currency, not a smart contract platform.
People buy BTC to hold it, not to use its block space. This gives Bitcoin an advantage that other chains don't have: Relying on everyone's demand for the currency to drive price increases, even with very low transaction fees, can still maintain network security.
However, this also means that Bitcoin's long-term security relies entirely on one assumption—that the price of the coin will always rise, a guarantee that no one can provide. Whether this chain can continue to act as a secure settlement layer does not depend on whether it can develop applications that earn transaction fees but on whether it can continuously maintain the narrative and market environment that make everyone willing to buy BTC. So far, this model has been operating normally, but when the block subsidy further reduces from 3.125 BTC to 1.5625 BTC, 0.78125 BTC, and in the future, three to four more halvings, whether it can fill the gap through price increases will be the most critical unknown in the crypto space.
You may also like

Gate founder Dr. Han: The crypto winter drives structural reshaping, and everything on-chain will become a new paradigm in finance

Is XRP a Good Investment in 2026? Why Is It Stuck at $1.45
XRP is up 6.7% this week, but exchange reserves remain high. Is a volatility spike imminent? We analyze price trend, ETF inflows, whale activity, and regulatory catalysts to answer: will XRP go up, why is XRP dropping, and is XRP a good investment right now?
TL; DR
What is XRP: XRP is a digital asset built for fast, low-cost international payments. It runs on the XRP Ledger and is used by Ripple for its On-Demand Liquidity (ODL) service. Unlike Bitcoin, XRP settles transactions in 3-5 seconds with near-zero fees.Why is XRP Dropping: XRP is not actively dropping, but it is struggling to rise. On the monthly chart, XRP has seen six consecutive months of decline. Currently, the price faces an additional supply wall at $1.45. About 1.24 billion XRP were bought in that range, and those holders sell when the price approaches, creating selling pressure that prevents a recovery.Will XRP Go Up: Potentially yes. XRP is trading near $1.43 and showing its best weekly performance since September 2025. If the price breaks above the $1.45 resistance, analysts expect a move toward $1.90, supported by strong institutional demand.Is XRP a Good Investment: The answer is not simple. Short-term traders may see opportunity in the coming volatility spike. Long-term investors face a bigger question that depends on one key regulatory event. However, the data reveals a surprising signal that most retail buyers are missing right now. To understand whether XRP is a smart buy or a trap at $1.43, you will need to read the full analysis below.What is XRP? A Digital Asset for Global SettlementBefore analyzing the charts, it is crucial to understand the asset in question. What is XRP? Unlike Bitcoin, which was designed as a decentralized digital gold, XRP operates on the XRP Ledger (XRPL). It was created to facilitate fast, low-cost international payments. Traditional bank transfers take days and incur high fees. XRP transactions settle in 3-5 seconds, costing fractions of a penny.
Ripple, the company associated with XRP, uses this asset for its "On-Demand Liquidity" (ODL) service. Banks and financial institutions use ODL to source liquidity during cross-border transactions without pre-funding accounts. This utility is the primary driver for institutional interest. Recently, the network hit a milestone of over 8 million active wallets, signaling growing usage despite recent price stagnation . Furthermore, Ripple is proactively preparing for the future, releasing a four-stage roadmap to make the XRPL "quantum-resistant," aiming to secure the ledger against future quantum computing threats by 2028 .
XRP Price Analysis: The Battle for $1.45The XRP price trend over the last month tells a story of exhaustion followed by cautious recovery. On the monthly chart, XRP experienced six consecutive months of decline. However, April shows signs of a bottoming process. Weekly charts reinforce this view: after four weeks of lower closes, the last two weeks have seen small rebounds.
According to data from April 22, 2026, XRP is trading at approximately $1.44. Over the last seven days, XRP has outperformed both Bitcoin and Ethereum, rising 6.7% while the broader market rose only 3.2%. Spot trading volume surged 23% to $3.79 billion, and derivative markets saw $40 billion in futures volume on a single day.
Despite this, the price remains 60% below its July 2025 high of $3.65. The current technical picture shows a "low volatility grind" higher. The 20-day EMA is at $1.3924, and the 50-day EMA is at $1.4119, both acting as support . However, the immediate hurdle is the $1.45 resistance level. This price point has rejected every rally attempt in 2026.
Why is XRP Dropping? And Will XRP Go Up?The primary reason for the recent "drop" (or lack of upward momentum) is not active selling, but rather the "supply wall." Data indicates that roughly 1.24 billion XRP tokens were purchased by investors in the $1.45 to $1.47 range. These investors have been waiting months to "break even." Every time the price approaches $1.45, these holders sell to exit their positions, creating a massive wall that retail buying cannot easily absorb.
However, the underlying momentum is shifting. Analysts suggest a xrp volatility spike imminent because the absorption capacity of buyers is increasing. Historically, when exchange reserves are high but the price refuses to drop significantly, it signals that buyers are absorbing the supply. The price has held above $1.39 despite the overhang, which is a sign of relative strength.
So, will XRP go up? Yes, potentially. But it needs a catalyst, if the price closes a daily candle above $1.45. If that happens, the next targets are $1.60 to $1.65, and eventually $1.90 .
XRP Exchange Netflow and XRP ETF Netflow: A Tale of Two MarketsThe current market dynamic is best understood by looking at two opposing data streams: XRP Exchange netflow and XRP ETF flows.
Exchange Dynamics (Retail / Whales):
Data shows a complex pattern of "large inflows and increasing reserves." Recently, a Ripple-associated wallet moved 75 million XRP (approx. $108 million) to Coinbase. This initially looks like a dump, but context matters. These transfers are likely to provide liquidity for Ripple’s ODL business, not necessarily spot market selling. However, the result is that exchange reserves have climbed to 2.76 billion XRP .
The Good News: While reserves are high, the rate of increase is slowing. Specifically, "whale" transfers to exchanges have dropped 98% from their April 11 peak. The Binance reserve has slightly decreased from 27.7 to 27.6 billion. The aggressive selling from large holders appears to have stopped.
Institutional Dynamics (ETF):
While whales were sending coins to exchanges, institutions were buying XRP ETF products. XRP ETF net flow is strongly positive.
US-listed XRP ETFs recorded four consecutive days of inflows totaling $38.86 million recently .The weekly inflow for mid-April hit $119.6 million, a multi-month high .Cumulative net inflows stand at $12.8 billion, with Assets Under Management (AUM) at roughly $10.8 billion.Analyzing the Divergence: Why Both Flows Are PositiveIt seems contradictory that exchange reserves are high (suggesting selling) while ETFs are buying (suggesting buying). However, this phenomenon reveals the current market structure.
Different Investor Profiles: The exchange inflows likely come from short-term traders, market makers, or Ripple itself providing ODL liquidity. These are "hot" coins ready to be sold. The ETF inflows represent "sticky" capital. Institutions buying ETFs are typically long-term holders (LTHs) or asset managers who do not day-trade. They are removing liquidity from the spot market by buying through custodians.The "De-risking" Trade: Sophisticated funds might be engaging in basis trading. They buy the ETF (taking a long position) while simultaneously shorting XRP futures or selling spot inventory to capture the funding rate. This keeps the price stable while volume increases.Absorption: The most likely scenario is that the market is simply absorbing the excess supply. The fact that the price is stable ($1.43) and not collapsing to $1.20 despite 2.76 billion coins sitting on exchanges is a massive win for the bulls. The ETF inflows are acting as a sponge, soaking up the selling pressure from the ODL wallets.The Regulatory Catalyst: The SEC and the CLARITY ActFundamentally, the recent price action cannot be separated from regulation. For years, the primary answer was the SEC lawsuit. That narrative is dying.
Ripple CEO Brad Garlinghouse recently praised SEC Chair Paul Atkins as "a breath of fresh air and sanity" . This regulatory thaw is critical. The SEC is reportedly considering dropping the long-standing lawsuit, and five XRP ETF applications are awaiting review.
The major catalyst on the horizon is the CLARITY Act. A Senate markup is expected before the end of April. Standard Chartered analysts project that if the bill advances, it could unlock $4 to $8 billion in institutional flows . Polymarket gives the bill a 60-66% chance of passing in 2026. If the CLARITY Act classifies XRP as a non-security (commodity), the institutional floodgates will open, likely overwhelming the $1.45 supply wall instantly.
Is XRP a Good Investment in 2026?Given all this data, is XRP a good investment? The answer depends entirely on your risk tolerance and time horizon.
The Bull Case (Why it is a good investment): The risk/reward ratio is asymmetrical to the upside. The price is near multi-year lows relative to its utility. Whale selling has stopped, ETF demand is rising, and the network is expanding (8 million wallets, quantum resistance roadmap). If the CLARITY Act passes, XRP could realistically trade between $1.60 and $1.80 in the short term, with a potential run to $3.00+ if the lawsuit is officially dropped.The Risk Case (Why it is NOT a good investment): There is a clear resistance wall at $1.45. If the CLARITY Act fails or is delayed past May (due to midterm election dynamics), the "buy the rumor, sell the news" dynamic could reverse. If the price fails to break $1.45 and loses support at $1.33, a drop back to $1.15 is technically possible .Verdict: XRP is a speculative buy for traders looking for a volatility spike. It is a hold for current investors. For new investors, it is only a good investment if you believe in regulatory clarity within the next 30 days. Technically, waiting for a confirmed break above $1.55 (to avoid the fakeout) is safer than buying at $1.43.
FAQQ: Will XRP go up if the CLARITY Act passes?
A: Yes, historically. Analysts predict that if the CLARITY Act passes, signaling that XRP is a commodity, it would remove the regulatory overhang. This could trigger a surge in institutional buying, pushing the price from the current $1.43 range to test the $1.80 - $2.00 resistance levels quickly.
Q: Why is XRP dropping when Bitcoin is going up?
A: XRP has specific supply dynamics. Unlike Bitcoin, which has a fixed supply issuance, XRP faces periodic sell-pressure from Ripple's treasury wallets used to fund ODL (liquidity) services. Additionally, the $1.45 "break-even" wall causes XRP to drop relative to BTC when short-term traders exit.
Q: Is a volatility spike imminent for XRP?
A: Yes. The Bollinger Bands on the daily chart are squeezing. The price is stuck between support at $1.33 and resistance at $1.45. Historically, when XRP volume surges 23% in a week (as it did on April 21), it precedes a violent move. The direction depends on whether the $1.45 resistance breaks.
Q: What is the XRP ETF netflow status?
A: As of late April 2026, XRP ETFs are seeing positive netflows. The US ETFs recorded a single week inflow of $119.6 million in mid-April. Cumulative inflows are strong at $12.8 billion, indicating that institutions are accumulating during this dip, which is a long-term bullish signal for price stabilization.
Q: Is XRP a good investment for beginners?
A: XRP is less volatile than "meme coins" but more volatile than Bitcoin. For beginners, it is a moderate-risk investment. Its value is tied to real utility (bank payments). However, beginners should wait to see if the price can close a weekly candle above $1.55 before entering, to avoid buying into the current resistance wall.
Disclaimer: None of the information in this article constitutes, or is intended to constitute, investment advice. Trading cryptocurrencies carries a high level of risk and may not be suitable for all investors. Always do your own research.
About WEEXFounded in 2018, WEEX has developed into a global crypto exchange with over 6.2 million users across more than 150 countries. The platform emphasizes security, liquidity, and usability, providing over 1,200 spot trading pairs and offering up to 400x leverage in crypto futures trading. In addition to the traditional spot and derivatives markets, WEEX is expanding rapidly in the AI era — delivering real-time AI news, empowering users with AI trading tools, and exploring innovative trade-to-earn models that make intelligent trading more accessible to everyone. Its 1,000 BTC Protection Fund further strengthens asset safety and transparency, while features such as copy trading and advanced trading tools allow users to follow professional traders and experience a more efficient, intelligent trading journey.
Follow WEEX on social mediaX: @WEEX_Official
Instagram: @WEEX Exchange
Tiktok: @weex_global
Youtube: @WEEX_Official
Discord: WEEX Community
Telegram: WeexGlobal Group

FC Barcelona vs Celta Vigo: Can Anyone Stop Barcelona at Home?
FC Barcelona vs Celta Vigo lineups, standings, and stats for April 22, 2026. FC Barcelona need a win to stay on track for the La Liga title. Full preview inside.
Carl Moon & WEEX Head to Mugello: The Crypto Trader's Ferrari Challenge
Forget the sidelines. WEEX is hitting the 300km/h mark at Mugello this weekend. Witness Carl Moon’s transformation from a supermarket cashier to a Ferrari racer, and discover why the world’s fastest trading floor belongs on the world’s most technical track at the official Ferrari Challenge.

How to Become a Pro Crypto Trader: WEEX Interview with Ferrari Racer Carl Moon
Ferrari racer Carl Moon on mastering crypto trading: 80/20 rule, AI tools, Bitcoin at $95K, and risk lessons from the track.

Morning Report | Amazon increases investment in Anthropic up to $25 billion; SEC plans to introduce an "innovation exemption" mechanism to support compliant on-chain trading of tokenized securities

Jeff Hoffman, founder of Booking.com: How Web3 and AI are reshaping the trillion-dollar social travel market

Top 12 Cryptocurrencies to Invest in April 2026
Key Takeaways: Bitcoin remains the dominant player with a $1.42 trillion market cap. Hyperliquid’s HYPE token gains traction,…
18 Best Crypto & Bitcoin Casinos in March 2026
Key Takeaways: Cryptocurrencies offer faster, cheaper, and more private payment options in online casinos. Top crypto casinos include…

Full Post-Mortem of the KelpDAO Incident: Why Did Aave, Which Was Not Compromised, End Up in Crisis Situation?
Key Takeaways: The KelpDAO incident exposed vulnerabilities in collateral pricing and cross-chain bridge operations, affecting Aave’s liquidity. rsETH…

Is MicroStrategy’s STRC Bitcoin’s Savior or Destroyer?
Key Takeaways: MicroStrategy’s STRC offers an annualized yield of 11.5%, driving significant Bitcoin buying pressure. Michael Saylor’s financial…

Ceasefire Expiration and Market Response: Bitcoin Defies Market Trends
Key Takeaways: The current ceasefire agreement is anticipated to expire on Wednesday in Washington, with low likelihood of…

Oil Price Dilemma: More Than a Price Hike
Key Takeaways: Global oil market has surpassed its breaking point, not solving with price hikes but facing significant…

On the Day Aave Launched rsETH, Spark Strategically Exited
Key Takeaways: Aave enabled rsETH lending at a 93% LTV, while Spark withdrew due to low utilization by…

Nasdaq Breaks Record and Crypto Transactions Surge
Key Takeaways: Nasdaq’s rise to a new intraday high indicates strong market momentum. A significant transfer of 35,000…

Powell: Fed Requires a Brand New Inflation Blueprint
Key Takeaways: Powell aims for transformative policy overhauls within the Fed if appointed. Past inflation response mistakes during…

Without Cook’s Apple, Can it Still Grow in the AI Era?
Key Takeaways: John Ternus acts more like a systematic integrator within Apple rather than a solo visionary. Apple’s…

Iran Stock Market and Crypto Developments in Focus
Key Takeaways: The Iranian stock market is set to reopen in 10 to 12 days, excluding companies impacted…
Gate founder Dr. Han: The crypto winter drives structural reshaping, and everything on-chain will become a new paradigm in finance
Is XRP a Good Investment in 2026? Why Is It Stuck at $1.45
XRP is up 6.7% this week, but exchange reserves remain high. Is a volatility spike imminent? We analyze price trend, ETF inflows, whale activity, and regulatory catalysts to answer: will XRP go up, why is XRP dropping, and is XRP a good investment right now?
TL; DR
What is XRP: XRP is a digital asset built for fast, low-cost international payments. It runs on the XRP Ledger and is used by Ripple for its On-Demand Liquidity (ODL) service. Unlike Bitcoin, XRP settles transactions in 3-5 seconds with near-zero fees.Why is XRP Dropping: XRP is not actively dropping, but it is struggling to rise. On the monthly chart, XRP has seen six consecutive months of decline. Currently, the price faces an additional supply wall at $1.45. About 1.24 billion XRP were bought in that range, and those holders sell when the price approaches, creating selling pressure that prevents a recovery.Will XRP Go Up: Potentially yes. XRP is trading near $1.43 and showing its best weekly performance since September 2025. If the price breaks above the $1.45 resistance, analysts expect a move toward $1.90, supported by strong institutional demand.Is XRP a Good Investment: The answer is not simple. Short-term traders may see opportunity in the coming volatility spike. Long-term investors face a bigger question that depends on one key regulatory event. However, the data reveals a surprising signal that most retail buyers are missing right now. To understand whether XRP is a smart buy or a trap at $1.43, you will need to read the full analysis below.What is XRP? A Digital Asset for Global SettlementBefore analyzing the charts, it is crucial to understand the asset in question. What is XRP? Unlike Bitcoin, which was designed as a decentralized digital gold, XRP operates on the XRP Ledger (XRPL). It was created to facilitate fast, low-cost international payments. Traditional bank transfers take days and incur high fees. XRP transactions settle in 3-5 seconds, costing fractions of a penny.
Ripple, the company associated with XRP, uses this asset for its "On-Demand Liquidity" (ODL) service. Banks and financial institutions use ODL to source liquidity during cross-border transactions without pre-funding accounts. This utility is the primary driver for institutional interest. Recently, the network hit a milestone of over 8 million active wallets, signaling growing usage despite recent price stagnation . Furthermore, Ripple is proactively preparing for the future, releasing a four-stage roadmap to make the XRPL "quantum-resistant," aiming to secure the ledger against future quantum computing threats by 2028 .
XRP Price Analysis: The Battle for $1.45The XRP price trend over the last month tells a story of exhaustion followed by cautious recovery. On the monthly chart, XRP experienced six consecutive months of decline. However, April shows signs of a bottoming process. Weekly charts reinforce this view: after four weeks of lower closes, the last two weeks have seen small rebounds.
According to data from April 22, 2026, XRP is trading at approximately $1.44. Over the last seven days, XRP has outperformed both Bitcoin and Ethereum, rising 6.7% while the broader market rose only 3.2%. Spot trading volume surged 23% to $3.79 billion, and derivative markets saw $40 billion in futures volume on a single day.
Despite this, the price remains 60% below its July 2025 high of $3.65. The current technical picture shows a "low volatility grind" higher. The 20-day EMA is at $1.3924, and the 50-day EMA is at $1.4119, both acting as support . However, the immediate hurdle is the $1.45 resistance level. This price point has rejected every rally attempt in 2026.
Why is XRP Dropping? And Will XRP Go Up?The primary reason for the recent "drop" (or lack of upward momentum) is not active selling, but rather the "supply wall." Data indicates that roughly 1.24 billion XRP tokens were purchased by investors in the $1.45 to $1.47 range. These investors have been waiting months to "break even." Every time the price approaches $1.45, these holders sell to exit their positions, creating a massive wall that retail buying cannot easily absorb.
However, the underlying momentum is shifting. Analysts suggest a xrp volatility spike imminent because the absorption capacity of buyers is increasing. Historically, when exchange reserves are high but the price refuses to drop significantly, it signals that buyers are absorbing the supply. The price has held above $1.39 despite the overhang, which is a sign of relative strength.
So, will XRP go up? Yes, potentially. But it needs a catalyst, if the price closes a daily candle above $1.45. If that happens, the next targets are $1.60 to $1.65, and eventually $1.90 .
XRP Exchange Netflow and XRP ETF Netflow: A Tale of Two MarketsThe current market dynamic is best understood by looking at two opposing data streams: XRP Exchange netflow and XRP ETF flows.
Exchange Dynamics (Retail / Whales):
Data shows a complex pattern of "large inflows and increasing reserves." Recently, a Ripple-associated wallet moved 75 million XRP (approx. $108 million) to Coinbase. This initially looks like a dump, but context matters. These transfers are likely to provide liquidity for Ripple’s ODL business, not necessarily spot market selling. However, the result is that exchange reserves have climbed to 2.76 billion XRP .
The Good News: While reserves are high, the rate of increase is slowing. Specifically, "whale" transfers to exchanges have dropped 98% from their April 11 peak. The Binance reserve has slightly decreased from 27.7 to 27.6 billion. The aggressive selling from large holders appears to have stopped.
Institutional Dynamics (ETF):
While whales were sending coins to exchanges, institutions were buying XRP ETF products. XRP ETF net flow is strongly positive.
US-listed XRP ETFs recorded four consecutive days of inflows totaling $38.86 million recently .The weekly inflow for mid-April hit $119.6 million, a multi-month high .Cumulative net inflows stand at $12.8 billion, with Assets Under Management (AUM) at roughly $10.8 billion.Analyzing the Divergence: Why Both Flows Are PositiveIt seems contradictory that exchange reserves are high (suggesting selling) while ETFs are buying (suggesting buying). However, this phenomenon reveals the current market structure.
Different Investor Profiles: The exchange inflows likely come from short-term traders, market makers, or Ripple itself providing ODL liquidity. These are "hot" coins ready to be sold. The ETF inflows represent "sticky" capital. Institutions buying ETFs are typically long-term holders (LTHs) or asset managers who do not day-trade. They are removing liquidity from the spot market by buying through custodians.The "De-risking" Trade: Sophisticated funds might be engaging in basis trading. They buy the ETF (taking a long position) while simultaneously shorting XRP futures or selling spot inventory to capture the funding rate. This keeps the price stable while volume increases.Absorption: The most likely scenario is that the market is simply absorbing the excess supply. The fact that the price is stable ($1.43) and not collapsing to $1.20 despite 2.76 billion coins sitting on exchanges is a massive win for the bulls. The ETF inflows are acting as a sponge, soaking up the selling pressure from the ODL wallets.The Regulatory Catalyst: The SEC and the CLARITY ActFundamentally, the recent price action cannot be separated from regulation. For years, the primary answer was the SEC lawsuit. That narrative is dying.
Ripple CEO Brad Garlinghouse recently praised SEC Chair Paul Atkins as "a breath of fresh air and sanity" . This regulatory thaw is critical. The SEC is reportedly considering dropping the long-standing lawsuit, and five XRP ETF applications are awaiting review.
The major catalyst on the horizon is the CLARITY Act. A Senate markup is expected before the end of April. Standard Chartered analysts project that if the bill advances, it could unlock $4 to $8 billion in institutional flows . Polymarket gives the bill a 60-66% chance of passing in 2026. If the CLARITY Act classifies XRP as a non-security (commodity), the institutional floodgates will open, likely overwhelming the $1.45 supply wall instantly.
Is XRP a Good Investment in 2026?Given all this data, is XRP a good investment? The answer depends entirely on your risk tolerance and time horizon.
The Bull Case (Why it is a good investment): The risk/reward ratio is asymmetrical to the upside. The price is near multi-year lows relative to its utility. Whale selling has stopped, ETF demand is rising, and the network is expanding (8 million wallets, quantum resistance roadmap). If the CLARITY Act passes, XRP could realistically trade between $1.60 and $1.80 in the short term, with a potential run to $3.00+ if the lawsuit is officially dropped.The Risk Case (Why it is NOT a good investment): There is a clear resistance wall at $1.45. If the CLARITY Act fails or is delayed past May (due to midterm election dynamics), the "buy the rumor, sell the news" dynamic could reverse. If the price fails to break $1.45 and loses support at $1.33, a drop back to $1.15 is technically possible .Verdict: XRP is a speculative buy for traders looking for a volatility spike. It is a hold for current investors. For new investors, it is only a good investment if you believe in regulatory clarity within the next 30 days. Technically, waiting for a confirmed break above $1.55 (to avoid the fakeout) is safer than buying at $1.43.
FAQQ: Will XRP go up if the CLARITY Act passes?
A: Yes, historically. Analysts predict that if the CLARITY Act passes, signaling that XRP is a commodity, it would remove the regulatory overhang. This could trigger a surge in institutional buying, pushing the price from the current $1.43 range to test the $1.80 - $2.00 resistance levels quickly.
Q: Why is XRP dropping when Bitcoin is going up?
A: XRP has specific supply dynamics. Unlike Bitcoin, which has a fixed supply issuance, XRP faces periodic sell-pressure from Ripple's treasury wallets used to fund ODL (liquidity) services. Additionally, the $1.45 "break-even" wall causes XRP to drop relative to BTC when short-term traders exit.
Q: Is a volatility spike imminent for XRP?
A: Yes. The Bollinger Bands on the daily chart are squeezing. The price is stuck between support at $1.33 and resistance at $1.45. Historically, when XRP volume surges 23% in a week (as it did on April 21), it precedes a violent move. The direction depends on whether the $1.45 resistance breaks.
Q: What is the XRP ETF netflow status?
A: As of late April 2026, XRP ETFs are seeing positive netflows. The US ETFs recorded a single week inflow of $119.6 million in mid-April. Cumulative inflows are strong at $12.8 billion, indicating that institutions are accumulating during this dip, which is a long-term bullish signal for price stabilization.
Q: Is XRP a good investment for beginners?
A: XRP is less volatile than "meme coins" but more volatile than Bitcoin. For beginners, it is a moderate-risk investment. Its value is tied to real utility (bank payments). However, beginners should wait to see if the price can close a weekly candle above $1.55 before entering, to avoid buying into the current resistance wall.
Disclaimer: None of the information in this article constitutes, or is intended to constitute, investment advice. Trading cryptocurrencies carries a high level of risk and may not be suitable for all investors. Always do your own research.
About WEEXFounded in 2018, WEEX has developed into a global crypto exchange with over 6.2 million users across more than 150 countries. The platform emphasizes security, liquidity, and usability, providing over 1,200 spot trading pairs and offering up to 400x leverage in crypto futures trading. In addition to the traditional spot and derivatives markets, WEEX is expanding rapidly in the AI era — delivering real-time AI news, empowering users with AI trading tools, and exploring innovative trade-to-earn models that make intelligent trading more accessible to everyone. Its 1,000 BTC Protection Fund further strengthens asset safety and transparency, while features such as copy trading and advanced trading tools allow users to follow professional traders and experience a more efficient, intelligent trading journey.
Follow WEEX on social mediaX: @WEEX_Official
Instagram: @WEEX Exchange
Tiktok: @weex_global
Youtube: @WEEX_Official
Discord: WEEX Community
Telegram: WeexGlobal Group
FC Barcelona vs Celta Vigo: Can Anyone Stop Barcelona at Home?
FC Barcelona vs Celta Vigo lineups, standings, and stats for April 22, 2026. FC Barcelona need a win to stay on track for the La Liga title. Full preview inside.
Carl Moon & WEEX Head to Mugello: The Crypto Trader's Ferrari Challenge
Forget the sidelines. WEEX is hitting the 300km/h mark at Mugello this weekend. Witness Carl Moon’s transformation from a supermarket cashier to a Ferrari racer, and discover why the world’s fastest trading floor belongs on the world’s most technical track at the official Ferrari Challenge.
How to Become a Pro Crypto Trader: WEEX Interview with Ferrari Racer Carl Moon
Ferrari racer Carl Moon on mastering crypto trading: 80/20 rule, AI tools, Bitcoin at $95K, and risk lessons from the track.
