 Buy Crypto
- Markets
 Futures
- Spot
- Copy Trade
- Earn
- More
Citrini Lingering Echo


Excellent articles can lead the market to mistake "scenario planning" for "realistic prophecy."
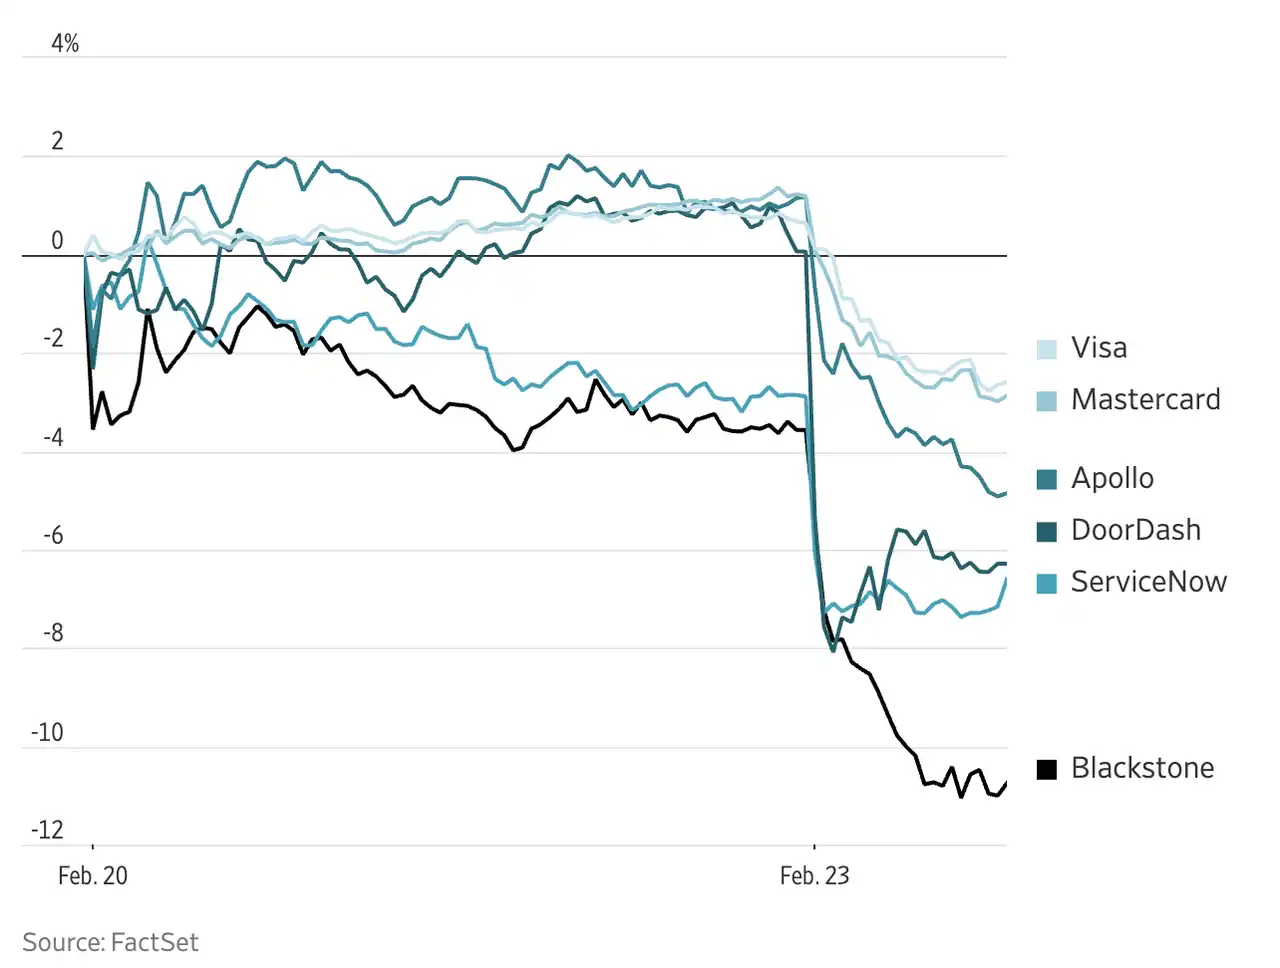
On February 22, 2026, a report titled "The 2028 Global Intelligence Crisis" set social media and the financial markets abuzz, garnering over 27 million views. On the day of the report's release, IBM plummeted by 13%, while companies like DoorDash, American Express, KKR, and others saw their stock prices drop by over 6%.
The report was authored by James van Geelen, the founder of Citrini Research. This 33-year-old researcher boasts over 180,000 followers on X and ranks first among financial writers on Substack. His focus is on equity investment and global macro research, known for his style of cross-asset, lateral thinking. His real investment portfolio has generated a return of over 200% since 2023. The report took the form of scenario planning and imagined a future set in 2028, where AI massively replaced white-collar labor in just two years. This led to consumer shrinkage, software asset defaults, credit tightening, eventually pushing the economy into a state of "technological prosperity" coexisting with "social decline." Geelen noted at the beginning of the article: "This article discusses a possible scenario, not a prophecy." However, the market evidently did not have the patience to distinguish between the two.
However, more worthy of attention than the brief market panic is the widespread discussion sparked by this article in the past few days. From academia to the investment community, from Wall Street to the Chinese internet, over a dozen response articles from different perspectives have emerged. Perhaps, instead of believing in a single extreme conclusion, we can piece together a clearer future from the "divergence and overlap" of various viewpoints.
What Citrini Said
The logical thread in Citrini's article is not complex: the leap in AI capabilities leads to the massive replacement of white-collar jobs → rising unemployment triggers a contraction in consumer spending → structured financial products based on SaaS face a wave of defaults → credit tightening spreads to a broader financial system → the economy falls into a state of "technological prosperity" coexisting with "social decline."
Each link in this chain of causality is not baseless. However, connecting them end-to-end and deducing a crisis requires a series of rather radical assumptions.
There are many ways to break down this chain. We might explore three core sub-arguments—namely, the speed and scale of labor replacement, the transmission mechanism of demand collapse, and the possibility of a financial crisis—and examine what different voices are debating around each link.
Creative Destruction
The starting point of Citrini's deduction is the large-scale replacement of white-collar labor by AI. In his narrative, this process accelerated sharply between 2026 and 2028, with professionals in fields such as law, financial analysis, software development, customer service, among others, being the most affected.
Change in the share of expenditure bycompanies on AI model suppliers and online labor platforms, grouped by industry AI exposure
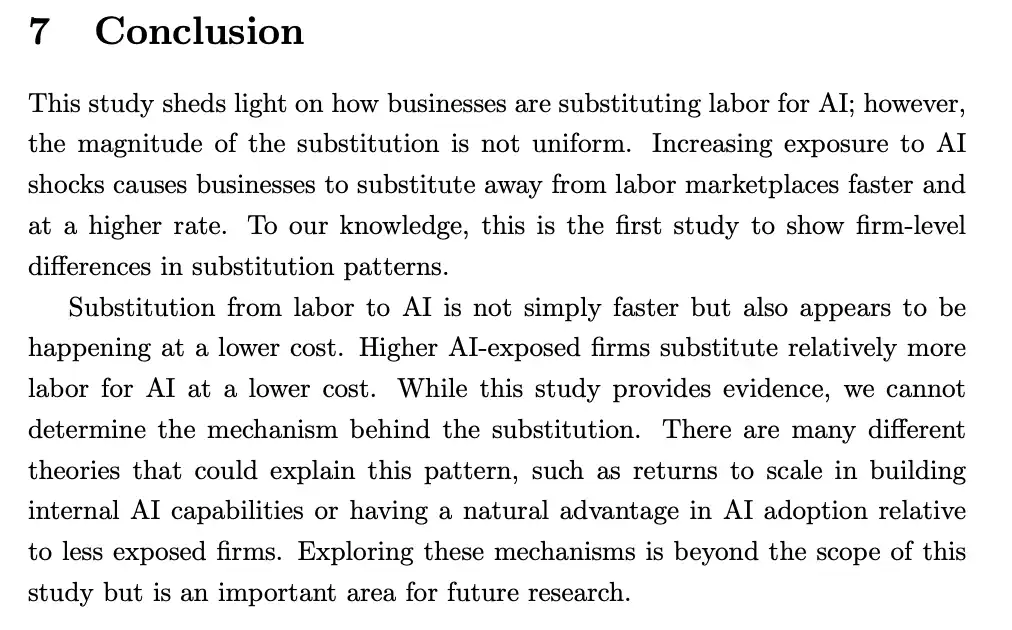
There is indeed evidence supporting Citrini's view. An empirical study by Bick, Blandin, and Deming based on enterprise spending data showed that, after the release of ChatGPT, the most AI-exposed companies (i.e., those that previously had the highest share of expenditure on online labor platforms) significantly increased their expenditure on AI model providers while reducing their expenditure on online labor platforms, with a reduction of around 15%. It is worth noting that this substitution is not a one-to-one replacement— for every $1 reduction in labor market expenditure, companies only increased AI expenditure by $0.03 to $0.30. In other words, AI is performing the same amount of work at a much lower cost than human labor.
But Citrini may have overestimated the speed of the transformation. Some critics point to the real estate agent industry in the United States as an example. Despite the long-existing technological capability to significantly reduce the number of real estate agents, this industry still employs over 1.5 million people. The inertia of the system, regulatory barriers, and internal industry dynamics form a much stronger defense line than technology. They believe that Citrini severely underestimated the resistance of "institutional momentum."
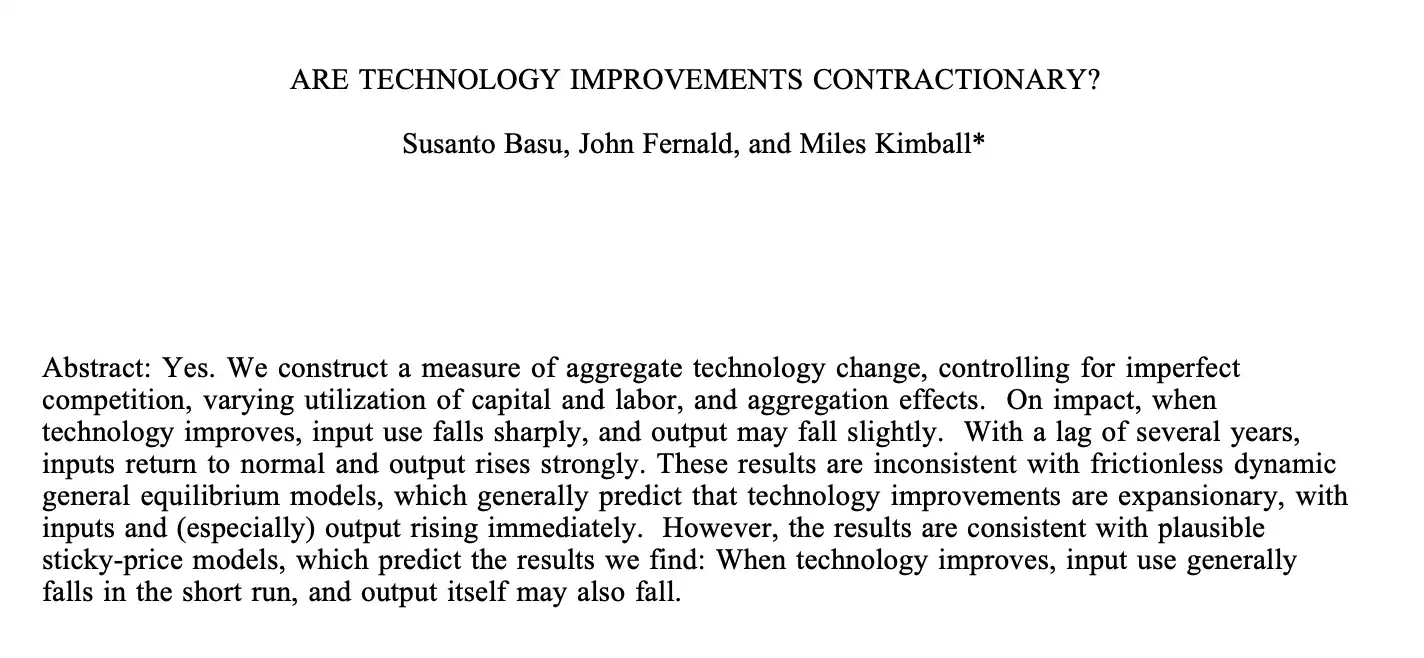
There are also critics who cite a study from 1998 by Kimball, Basu, and Fernald, pointing out that technological shocks have historically been a positive stimulus to the supply side—while there may be short-term adjustments in employment structure, the output space it creates in the long term far exceeds the jobs it destroys.
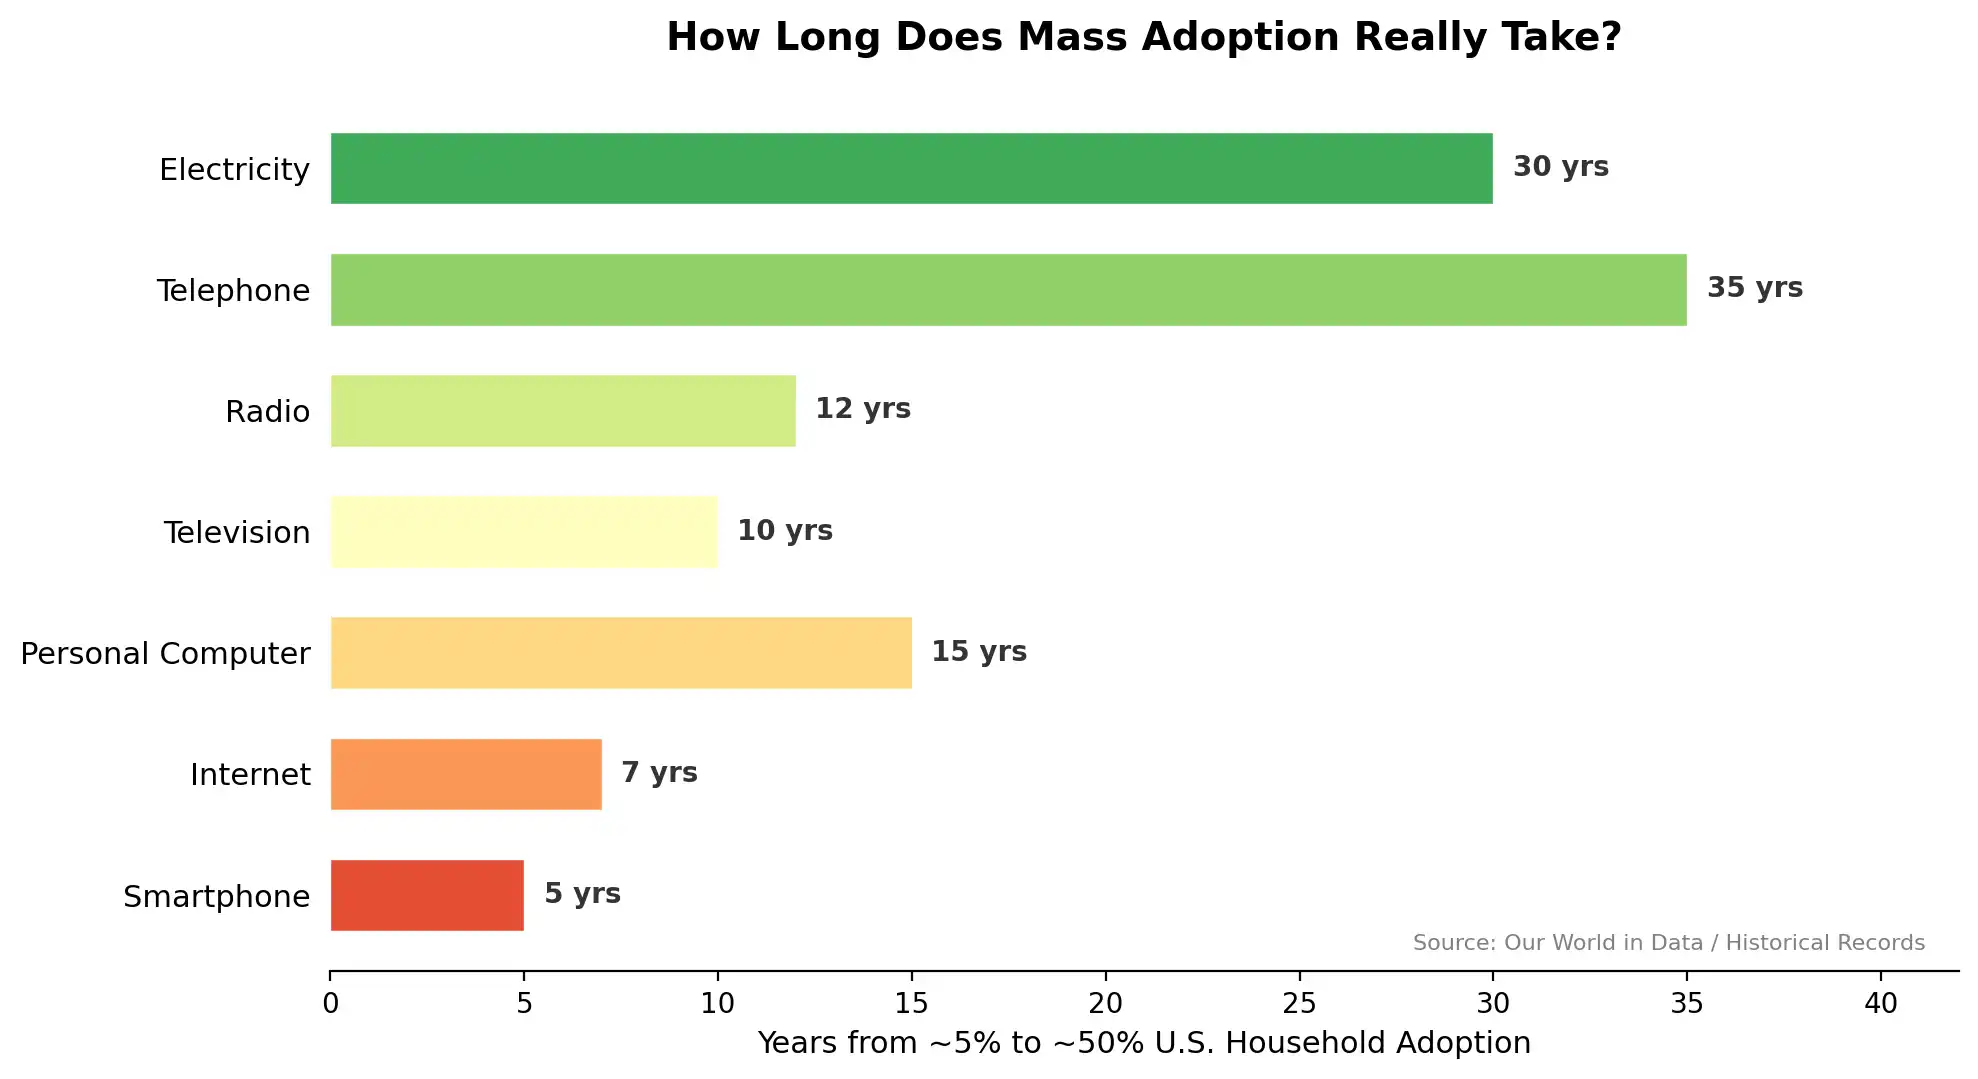
In fact, looking back at the diffusion process of every previous general-purpose technology in history, the journey from the laboratory to widespread adoption has always been much slower than the maturity of the technology itself. It took 30 years for electricity to go from a 5% household adoption rate to 50%, 35 years for the telephone, and even the fastest-diffusing smartphone took 5 years. While the technical capabilities of AI may already be sufficient to disrupt many industries, the gap between technical capability and institutional absorption has never been one that could be bridged by capability alone.
The second key link in the Citrini narrative is a downward spiral on the demand side: unemployment → reduced income → decreased consumption → declining corporate profits → further layoffs.
In this link, Citrini confuses demand-side deflation with supply-side deflation. The former implies a shrinking consumer purchasing power, while the latter is where technological progress lowers production costs — AI-driven price decreases are essentially closer to the latter, similar to the price trajectory of electronic products and communication services over the past few decades. Some analysts believe that the Jevons Paradox will still apply: when AI significantly reduces the cost of services such as legal consulting, medical diagnosis, software development, etc., the demand that was previously excluded by high prices will be unleashed, resulting not in shrinkage but in explosive growth. At the same time, the "Moravec Paradox" will also come into play. For machines, the truly difficult tasks are often not deep logical reasoning or massive data retrieval, but rather human routine physical movements, sensory perception, and emotional communication. This means that jobs requiring physical labor and intricate perception in the service industry may be more resilient than we imagine.
But the Jevons Paradox may also fail.University of Chicago economics professor Alex Imas has suggested that if AI automates the vast majority of labor and the share of labor income in total income sharply declines, then who will be able to purchase the goods and services produced efficiently? This touches on the distribution mechanism itself. When output capacity tends toward infinity while effective demand tends to concentrate, what we may face is not a recession, but an imbalance that economics textbooks have not fully discussed — material abundance that is out of reach.
A Glimpse Behind the Curtain
In Citrini's extrapolation, the most significant part of the scenario is the transmission from employment shock to financial crisis. In his narrative, structured finance products backed by SaaS revenue (which he refers to as "Software-Backed Securities") faced widespread defaults during the AI transformation wave, triggering a credit crunch similar to 2008.
However, commentators note that, compared to 2008, the current leverage of the U.S. corporate sector is much healthier, and the banking system is far more robust after experiencing Dodd-Frank reforms and multiple rounds of stress tests.
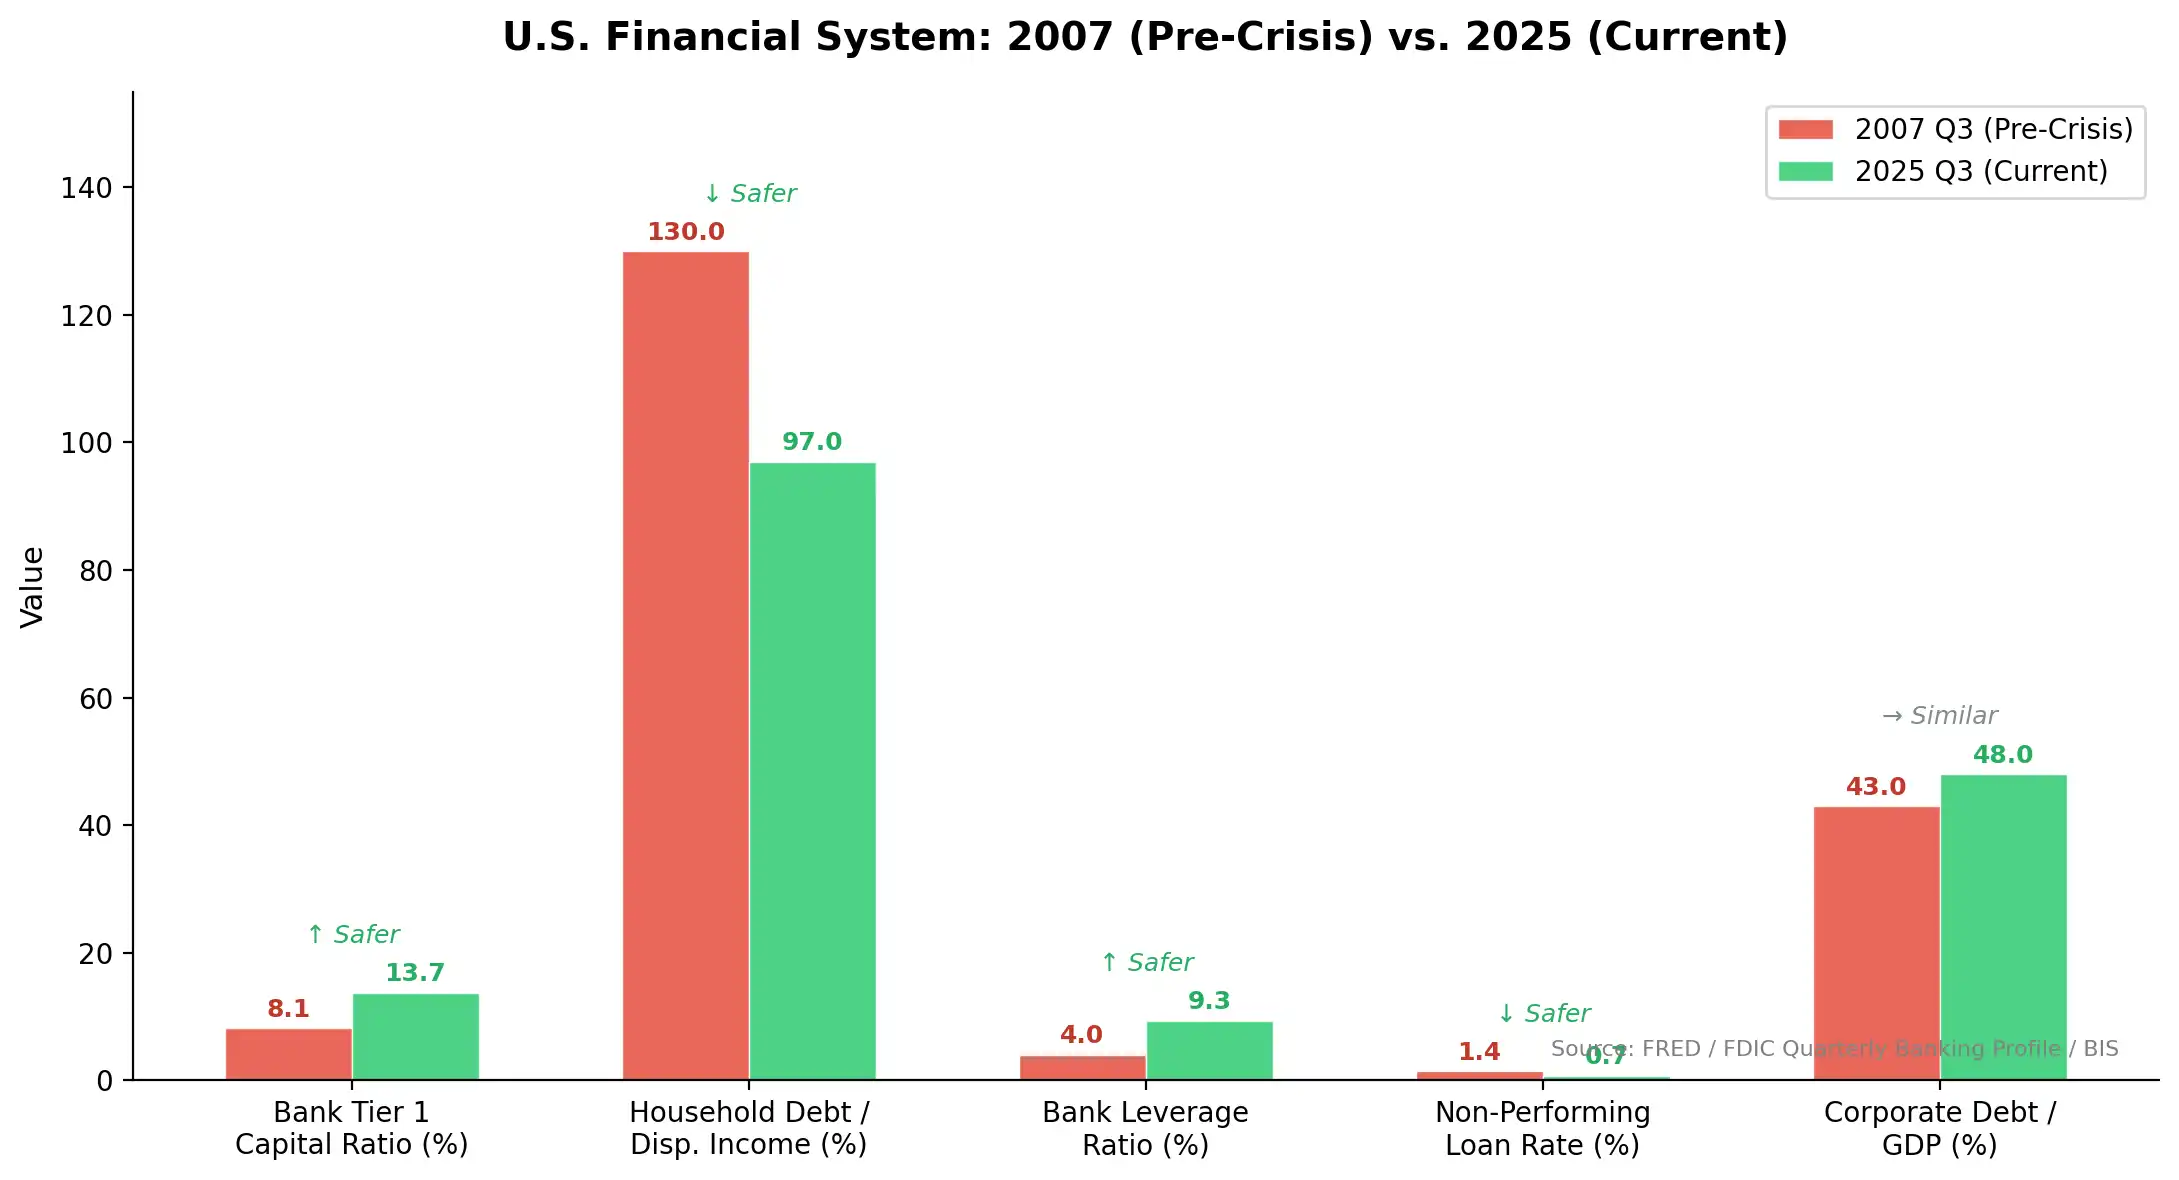
Compared to the eve of the 2008 financial crisis, various resilience indicators of the current U.S. financial system have significantly improved: the bank tier 1 capital adequacy ratio has increased from 8.1% to 13.7%, the household debt-to-disposable income ratio has decreased from 130% to 97%, and the non-performing loan ratio has dropped from 1.4% to 0.7%.
Even if some SaaS companies do face revenue decline, the scale is not enough to trigger a systemic credit crisis. Former Bloomberg columnist Nick Smith believes Citrini made a common mistake at this point: linearly extrapolating micro-level industry shocks to macro-level systemic risks. For demand collapse, Smith's answer is fiscal policy. If unemployment indeed rises significantly, the government has the capacity and willingness to shore up demand through large-scale fiscal stimulus.
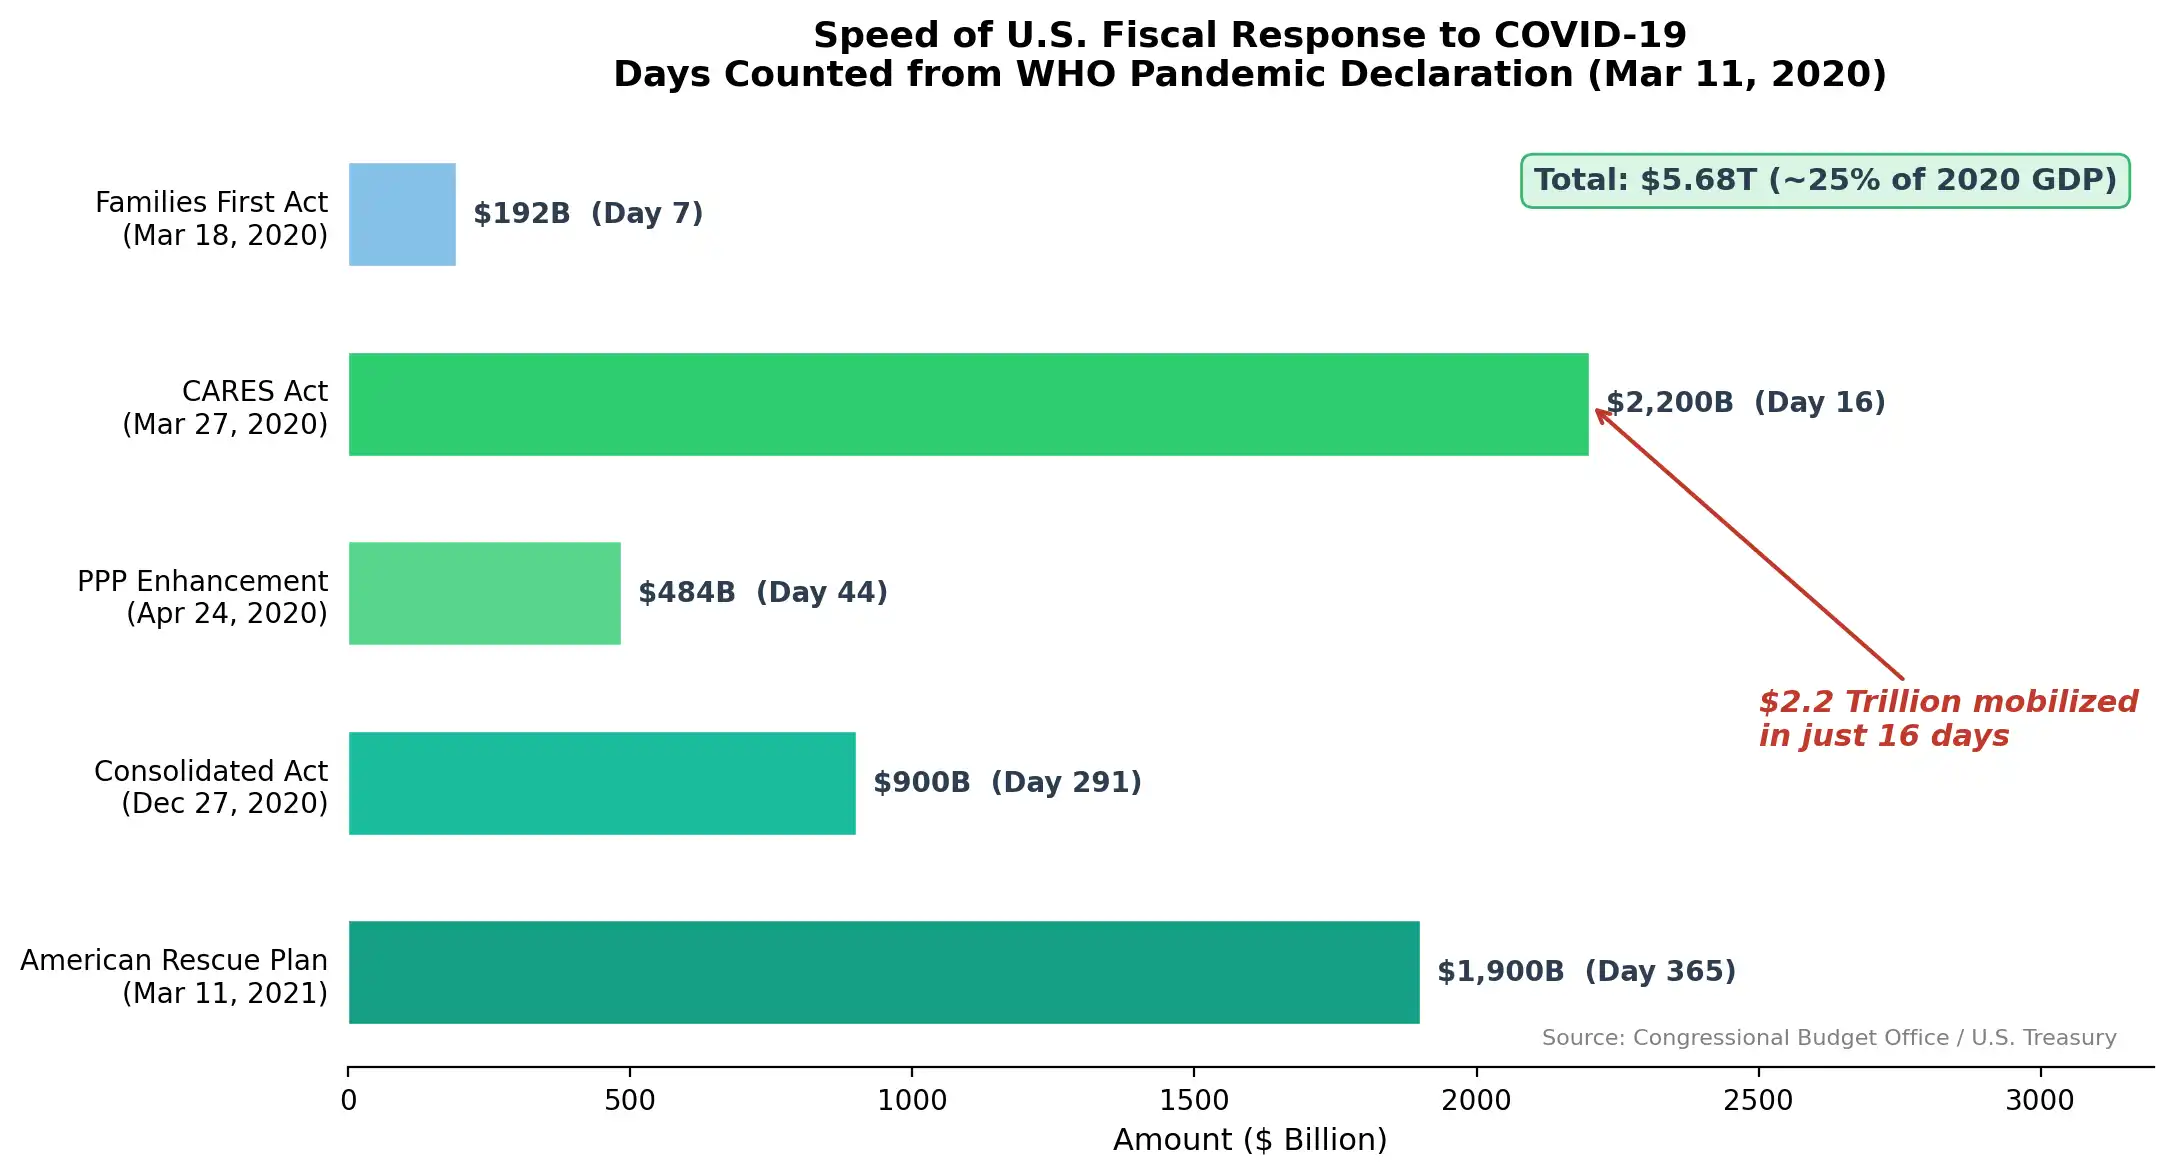
The institutional responsiveness also appears to have been underestimated, as evidenced by the policy response during the COVID period. For instance, on March 11, 2020, when the WHO declared a pandemic, just 16 days later, the $2.2 trillion CARES Act was signed into effect. In the following year, the U.S. introduced a cumulative $5.68 trillion in fiscal stimulus, equivalent to about 25% of the 2020 GDP.
If AI-driven unemployment does materialize at the speed and scale described by Citrini, policy intervention is unlikely to be absent.
Some commentators have raised doubts from a more fundamental level. Technological doomsday scenarios often stem from a lack of faith in the humanities. Citrini's extrapolation views the market as an unmanned machine, allowing "causality" to unfold until collapse. However, the real-world economic system does not operate in this manner. Law, institutions, politics, culture, and ideology profoundly shape how the real world absorbs technological shocks.
Consensus and Dissent
Perhaps we can try to annotate some consensus and dissent.
AI is currently and will continue to alter the demand structure of white-collar labor almost beyond dispute; the dissent lies only in the pace and scale of change. Moreover, the pains of transition are very real and should not be obscured by excessive optimism. Additionally, the quality and speed of policy responses will greatly determine the outcome.
Dissent lies in a more fundamental level of logic. Some believe that this current technological shock may surpass historical precedents in both speed and breadth, thus limiting the relevance of historical analogies; while others have more trust in institutional adaptability and historical repetition.
Heads Up
Citrini's article presents several issues, with overly tight logical connections, systemic underestimation of institutional responses, and a lack of sufficient intermediate arguments from micro-industry impacts to macro-systemic risks. But its most fundamental issue may lie in an underestimation of human society: it assumes a static institutional environment in which technology crushes everything at an almost unstoppable pace. There has been no shortage of doomsday scenarios in the history of technology, often unassailable in technological logic, yet almost uniformly overlooking the variable of "humans." The complexity of human society, its friction, its redundancy, its seemingly inefficient institutional arrangements, precisely constitute a powerful, distributed resistance to shocks. We have ample time to avert those extrapolated doomsdays, provided we are not intimidated by the extrapolations themselves.
What about the optimistic narratives? The "Jevons Paradox" is an observation about long-term trends. The "Moravec Paradox" tells us that physical labor is temporarily safe but does not tell us where those displaced white-collar workers should go. Historical analogies are enlightening, but history never repeats exactly; it only rhymes. Optimistic narratives need time to be tested, and we are currently at the starting point of that test.
Doomsday scenarios are produced, and the anxious pay the price. Forge your judgment, take risks, manage positions, instead of indulging in those "see into the future at a glance" articles.
You may also like

Gate founder Dr. Han: The crypto winter drives structural reshaping, and everything on-chain will become a new paradigm in finance

Is XRP a Good Investment in 2026? Why Is It Stuck at $1.45
XRP is up 6.7% this week, but exchange reserves remain high. Is a volatility spike imminent? We analyze price trend, ETF inflows, whale activity, and regulatory catalysts to answer: will XRP go up, why is XRP dropping, and is XRP a good investment right now?
TL; DR
What is XRP: XRP is a digital asset built for fast, low-cost international payments. It runs on the XRP Ledger and is used by Ripple for its On-Demand Liquidity (ODL) service. Unlike Bitcoin, XRP settles transactions in 3-5 seconds with near-zero fees.Why is XRP Dropping: XRP is not actively dropping, but it is struggling to rise. On the monthly chart, XRP has seen six consecutive months of decline. Currently, the price faces an additional supply wall at $1.45. About 1.24 billion XRP were bought in that range, and those holders sell when the price approaches, creating selling pressure that prevents a recovery.Will XRP Go Up: Potentially yes. XRP is trading near $1.43 and showing its best weekly performance since September 2025. If the price breaks above the $1.45 resistance, analysts expect a move toward $1.90, supported by strong institutional demand.Is XRP a Good Investment: The answer is not simple. Short-term traders may see opportunity in the coming volatility spike. Long-term investors face a bigger question that depends on one key regulatory event. However, the data reveals a surprising signal that most retail buyers are missing right now. To understand whether XRP is a smart buy or a trap at $1.43, you will need to read the full analysis below.What is XRP? A Digital Asset for Global SettlementBefore analyzing the charts, it is crucial to understand the asset in question. What is XRP? Unlike Bitcoin, which was designed as a decentralized digital gold, XRP operates on the XRP Ledger (XRPL). It was created to facilitate fast, low-cost international payments. Traditional bank transfers take days and incur high fees. XRP transactions settle in 3-5 seconds, costing fractions of a penny.
Ripple, the company associated with XRP, uses this asset for its "On-Demand Liquidity" (ODL) service. Banks and financial institutions use ODL to source liquidity during cross-border transactions without pre-funding accounts. This utility is the primary driver for institutional interest. Recently, the network hit a milestone of over 8 million active wallets, signaling growing usage despite recent price stagnation . Furthermore, Ripple is proactively preparing for the future, releasing a four-stage roadmap to make the XRPL "quantum-resistant," aiming to secure the ledger against future quantum computing threats by 2028 .
XRP Price Analysis: The Battle for $1.45The XRP price trend over the last month tells a story of exhaustion followed by cautious recovery. On the monthly chart, XRP experienced six consecutive months of decline. However, April shows signs of a bottoming process. Weekly charts reinforce this view: after four weeks of lower closes, the last two weeks have seen small rebounds.
According to data from April 22, 2026, XRP is trading at approximately $1.44. Over the last seven days, XRP has outperformed both Bitcoin and Ethereum, rising 6.7% while the broader market rose only 3.2%. Spot trading volume surged 23% to $3.79 billion, and derivative markets saw $40 billion in futures volume on a single day.
Despite this, the price remains 60% below its July 2025 high of $3.65. The current technical picture shows a "low volatility grind" higher. The 20-day EMA is at $1.3924, and the 50-day EMA is at $1.4119, both acting as support . However, the immediate hurdle is the $1.45 resistance level. This price point has rejected every rally attempt in 2026.
Why is XRP Dropping? And Will XRP Go Up?The primary reason for the recent "drop" (or lack of upward momentum) is not active selling, but rather the "supply wall." Data indicates that roughly 1.24 billion XRP tokens were purchased by investors in the $1.45 to $1.47 range. These investors have been waiting months to "break even." Every time the price approaches $1.45, these holders sell to exit their positions, creating a massive wall that retail buying cannot easily absorb.
However, the underlying momentum is shifting. Analysts suggest a xrp volatility spike imminent because the absorption capacity of buyers is increasing. Historically, when exchange reserves are high but the price refuses to drop significantly, it signals that buyers are absorbing the supply. The price has held above $1.39 despite the overhang, which is a sign of relative strength.
So, will XRP go up? Yes, potentially. But it needs a catalyst, if the price closes a daily candle above $1.45. If that happens, the next targets are $1.60 to $1.65, and eventually $1.90 .
XRP Exchange Netflow and XRP ETF Netflow: A Tale of Two MarketsThe current market dynamic is best understood by looking at two opposing data streams: XRP Exchange netflow and XRP ETF flows.
Exchange Dynamics (Retail / Whales):
Data shows a complex pattern of "large inflows and increasing reserves." Recently, a Ripple-associated wallet moved 75 million XRP (approx. $108 million) to Coinbase. This initially looks like a dump, but context matters. These transfers are likely to provide liquidity for Ripple’s ODL business, not necessarily spot market selling. However, the result is that exchange reserves have climbed to 2.76 billion XRP .
The Good News: While reserves are high, the rate of increase is slowing. Specifically, "whale" transfers to exchanges have dropped 98% from their April 11 peak. The Binance reserve has slightly decreased from 27.7 to 27.6 billion. The aggressive selling from large holders appears to have stopped.
Institutional Dynamics (ETF):
While whales were sending coins to exchanges, institutions were buying XRP ETF products. XRP ETF net flow is strongly positive.
US-listed XRP ETFs recorded four consecutive days of inflows totaling $38.86 million recently .The weekly inflow for mid-April hit $119.6 million, a multi-month high .Cumulative net inflows stand at $12.8 billion, with Assets Under Management (AUM) at roughly $10.8 billion.Analyzing the Divergence: Why Both Flows Are PositiveIt seems contradictory that exchange reserves are high (suggesting selling) while ETFs are buying (suggesting buying). However, this phenomenon reveals the current market structure.
Different Investor Profiles: The exchange inflows likely come from short-term traders, market makers, or Ripple itself providing ODL liquidity. These are "hot" coins ready to be sold. The ETF inflows represent "sticky" capital. Institutions buying ETFs are typically long-term holders (LTHs) or asset managers who do not day-trade. They are removing liquidity from the spot market by buying through custodians.The "De-risking" Trade: Sophisticated funds might be engaging in basis trading. They buy the ETF (taking a long position) while simultaneously shorting XRP futures or selling spot inventory to capture the funding rate. This keeps the price stable while volume increases.Absorption: The most likely scenario is that the market is simply absorbing the excess supply. The fact that the price is stable ($1.43) and not collapsing to $1.20 despite 2.76 billion coins sitting on exchanges is a massive win for the bulls. The ETF inflows are acting as a sponge, soaking up the selling pressure from the ODL wallets.The Regulatory Catalyst: The SEC and the CLARITY ActFundamentally, the recent price action cannot be separated from regulation. For years, the primary answer was the SEC lawsuit. That narrative is dying.
Ripple CEO Brad Garlinghouse recently praised SEC Chair Paul Atkins as "a breath of fresh air and sanity" . This regulatory thaw is critical. The SEC is reportedly considering dropping the long-standing lawsuit, and five XRP ETF applications are awaiting review.
The major catalyst on the horizon is the CLARITY Act. A Senate markup is expected before the end of April. Standard Chartered analysts project that if the bill advances, it could unlock $4 to $8 billion in institutional flows . Polymarket gives the bill a 60-66% chance of passing in 2026. If the CLARITY Act classifies XRP as a non-security (commodity), the institutional floodgates will open, likely overwhelming the $1.45 supply wall instantly.
Is XRP a Good Investment in 2026?Given all this data, is XRP a good investment? The answer depends entirely on your risk tolerance and time horizon.
The Bull Case (Why it is a good investment): The risk/reward ratio is asymmetrical to the upside. The price is near multi-year lows relative to its utility. Whale selling has stopped, ETF demand is rising, and the network is expanding (8 million wallets, quantum resistance roadmap). If the CLARITY Act passes, XRP could realistically trade between $1.60 and $1.80 in the short term, with a potential run to $3.00+ if the lawsuit is officially dropped.The Risk Case (Why it is NOT a good investment): There is a clear resistance wall at $1.45. If the CLARITY Act fails or is delayed past May (due to midterm election dynamics), the "buy the rumor, sell the news" dynamic could reverse. If the price fails to break $1.45 and loses support at $1.33, a drop back to $1.15 is technically possible .Verdict: XRP is a speculative buy for traders looking for a volatility spike. It is a hold for current investors. For new investors, it is only a good investment if you believe in regulatory clarity within the next 30 days. Technically, waiting for a confirmed break above $1.55 (to avoid the fakeout) is safer than buying at $1.43.
FAQQ: Will XRP go up if the CLARITY Act passes?
A: Yes, historically. Analysts predict that if the CLARITY Act passes, signaling that XRP is a commodity, it would remove the regulatory overhang. This could trigger a surge in institutional buying, pushing the price from the current $1.43 range to test the $1.80 - $2.00 resistance levels quickly.
Q: Why is XRP dropping when Bitcoin is going up?
A: XRP has specific supply dynamics. Unlike Bitcoin, which has a fixed supply issuance, XRP faces periodic sell-pressure from Ripple's treasury wallets used to fund ODL (liquidity) services. Additionally, the $1.45 "break-even" wall causes XRP to drop relative to BTC when short-term traders exit.
Q: Is a volatility spike imminent for XRP?
A: Yes. The Bollinger Bands on the daily chart are squeezing. The price is stuck between support at $1.33 and resistance at $1.45. Historically, when XRP volume surges 23% in a week (as it did on April 21), it precedes a violent move. The direction depends on whether the $1.45 resistance breaks.
Q: What is the XRP ETF netflow status?
A: As of late April 2026, XRP ETFs are seeing positive netflows. The US ETFs recorded a single week inflow of $119.6 million in mid-April. Cumulative inflows are strong at $12.8 billion, indicating that institutions are accumulating during this dip, which is a long-term bullish signal for price stabilization.
Q: Is XRP a good investment for beginners?
A: XRP is less volatile than "meme coins" but more volatile than Bitcoin. For beginners, it is a moderate-risk investment. Its value is tied to real utility (bank payments). However, beginners should wait to see if the price can close a weekly candle above $1.55 before entering, to avoid buying into the current resistance wall.
Disclaimer: None of the information in this article constitutes, or is intended to constitute, investment advice. Trading cryptocurrencies carries a high level of risk and may not be suitable for all investors. Always do your own research.
About WEEXFounded in 2018, WEEX has developed into a global crypto exchange with over 6.2 million users across more than 150 countries. The platform emphasizes security, liquidity, and usability, providing over 1,200 spot trading pairs and offering up to 400x leverage in crypto futures trading. In addition to the traditional spot and derivatives markets, WEEX is expanding rapidly in the AI era — delivering real-time AI news, empowering users with AI trading tools, and exploring innovative trade-to-earn models that make intelligent trading more accessible to everyone. Its 1,000 BTC Protection Fund further strengthens asset safety and transparency, while features such as copy trading and advanced trading tools allow users to follow professional traders and experience a more efficient, intelligent trading journey.
Follow WEEX on social mediaX: @WEEX_Official
Instagram: @WEEX Exchange
Tiktok: @weex_global
Youtube: @WEEX_Official
Discord: WEEX Community
Telegram: WeexGlobal Group

FC Barcelona vs Celta Vigo: Can Anyone Stop Barcelona at Home?
FC Barcelona vs Celta Vigo lineups, standings, and stats for April 22, 2026. FC Barcelona need a win to stay on track for the La Liga title. Full preview inside.
Carl Moon & WEEX Head to Mugello: The Crypto Trader's Ferrari Challenge
Forget the sidelines. WEEX is hitting the 300km/h mark at Mugello this weekend. Witness Carl Moon’s transformation from a supermarket cashier to a Ferrari racer, and discover why the world’s fastest trading floor belongs on the world’s most technical track at the official Ferrari Challenge.

How to Become a Pro Crypto Trader: WEEX Interview with Ferrari Racer Carl Moon
Ferrari racer Carl Moon on mastering crypto trading: 80/20 rule, AI tools, Bitcoin at $95K, and risk lessons from the track.

Morning Report | Amazon increases investment in Anthropic up to $25 billion; SEC plans to introduce an "innovation exemption" mechanism to support compliant on-chain trading of tokenized securities

Jeff Hoffman, founder of Booking.com: How Web3 and AI are reshaping the trillion-dollar social travel market

Top 12 Cryptocurrencies to Invest in April 2026
Key Takeaways: Bitcoin remains the dominant player with a $1.42 trillion market cap. Hyperliquid’s HYPE token gains traction,…
18 Best Crypto & Bitcoin Casinos in March 2026
Key Takeaways: Cryptocurrencies offer faster, cheaper, and more private payment options in online casinos. Top crypto casinos include…

Full Post-Mortem of the KelpDAO Incident: Why Did Aave, Which Was Not Compromised, End Up in Crisis Situation?
Key Takeaways: The KelpDAO incident exposed vulnerabilities in collateral pricing and cross-chain bridge operations, affecting Aave’s liquidity. rsETH…

Is MicroStrategy’s STRC Bitcoin’s Savior or Destroyer?
Key Takeaways: MicroStrategy’s STRC offers an annualized yield of 11.5%, driving significant Bitcoin buying pressure. Michael Saylor’s financial…

Ceasefire Expiration and Market Response: Bitcoin Defies Market Trends
Key Takeaways: The current ceasefire agreement is anticipated to expire on Wednesday in Washington, with low likelihood of…

Oil Price Dilemma: More Than a Price Hike
Key Takeaways: Global oil market has surpassed its breaking point, not solving with price hikes but facing significant…

On the Day Aave Launched rsETH, Spark Strategically Exited
Key Takeaways: Aave enabled rsETH lending at a 93% LTV, while Spark withdrew due to low utilization by…

Nasdaq Breaks Record and Crypto Transactions Surge
Key Takeaways: Nasdaq’s rise to a new intraday high indicates strong market momentum. A significant transfer of 35,000…

Powell: Fed Requires a Brand New Inflation Blueprint
Key Takeaways: Powell aims for transformative policy overhauls within the Fed if appointed. Past inflation response mistakes during…

Without Cook’s Apple, Can it Still Grow in the AI Era?
Key Takeaways: John Ternus acts more like a systematic integrator within Apple rather than a solo visionary. Apple’s…

Iran Stock Market and Crypto Developments in Focus
Key Takeaways: The Iranian stock market is set to reopen in 10 to 12 days, excluding companies impacted…
Gate founder Dr. Han: The crypto winter drives structural reshaping, and everything on-chain will become a new paradigm in finance
Is XRP a Good Investment in 2026? Why Is It Stuck at $1.45
XRP is up 6.7% this week, but exchange reserves remain high. Is a volatility spike imminent? We analyze price trend, ETF inflows, whale activity, and regulatory catalysts to answer: will XRP go up, why is XRP dropping, and is XRP a good investment right now?
TL; DR
What is XRP: XRP is a digital asset built for fast, low-cost international payments. It runs on the XRP Ledger and is used by Ripple for its On-Demand Liquidity (ODL) service. Unlike Bitcoin, XRP settles transactions in 3-5 seconds with near-zero fees.Why is XRP Dropping: XRP is not actively dropping, but it is struggling to rise. On the monthly chart, XRP has seen six consecutive months of decline. Currently, the price faces an additional supply wall at $1.45. About 1.24 billion XRP were bought in that range, and those holders sell when the price approaches, creating selling pressure that prevents a recovery.Will XRP Go Up: Potentially yes. XRP is trading near $1.43 and showing its best weekly performance since September 2025. If the price breaks above the $1.45 resistance, analysts expect a move toward $1.90, supported by strong institutional demand.Is XRP a Good Investment: The answer is not simple. Short-term traders may see opportunity in the coming volatility spike. Long-term investors face a bigger question that depends on one key regulatory event. However, the data reveals a surprising signal that most retail buyers are missing right now. To understand whether XRP is a smart buy or a trap at $1.43, you will need to read the full analysis below.What is XRP? A Digital Asset for Global SettlementBefore analyzing the charts, it is crucial to understand the asset in question. What is XRP? Unlike Bitcoin, which was designed as a decentralized digital gold, XRP operates on the XRP Ledger (XRPL). It was created to facilitate fast, low-cost international payments. Traditional bank transfers take days and incur high fees. XRP transactions settle in 3-5 seconds, costing fractions of a penny.
Ripple, the company associated with XRP, uses this asset for its "On-Demand Liquidity" (ODL) service. Banks and financial institutions use ODL to source liquidity during cross-border transactions without pre-funding accounts. This utility is the primary driver for institutional interest. Recently, the network hit a milestone of over 8 million active wallets, signaling growing usage despite recent price stagnation . Furthermore, Ripple is proactively preparing for the future, releasing a four-stage roadmap to make the XRPL "quantum-resistant," aiming to secure the ledger against future quantum computing threats by 2028 .
XRP Price Analysis: The Battle for $1.45The XRP price trend over the last month tells a story of exhaustion followed by cautious recovery. On the monthly chart, XRP experienced six consecutive months of decline. However, April shows signs of a bottoming process. Weekly charts reinforce this view: after four weeks of lower closes, the last two weeks have seen small rebounds.
According to data from April 22, 2026, XRP is trading at approximately $1.44. Over the last seven days, XRP has outperformed both Bitcoin and Ethereum, rising 6.7% while the broader market rose only 3.2%. Spot trading volume surged 23% to $3.79 billion, and derivative markets saw $40 billion in futures volume on a single day.
Despite this, the price remains 60% below its July 2025 high of $3.65. The current technical picture shows a "low volatility grind" higher. The 20-day EMA is at $1.3924, and the 50-day EMA is at $1.4119, both acting as support . However, the immediate hurdle is the $1.45 resistance level. This price point has rejected every rally attempt in 2026.
Why is XRP Dropping? And Will XRP Go Up?The primary reason for the recent "drop" (or lack of upward momentum) is not active selling, but rather the "supply wall." Data indicates that roughly 1.24 billion XRP tokens were purchased by investors in the $1.45 to $1.47 range. These investors have been waiting months to "break even." Every time the price approaches $1.45, these holders sell to exit their positions, creating a massive wall that retail buying cannot easily absorb.
However, the underlying momentum is shifting. Analysts suggest a xrp volatility spike imminent because the absorption capacity of buyers is increasing. Historically, when exchange reserves are high but the price refuses to drop significantly, it signals that buyers are absorbing the supply. The price has held above $1.39 despite the overhang, which is a sign of relative strength.
So, will XRP go up? Yes, potentially. But it needs a catalyst, if the price closes a daily candle above $1.45. If that happens, the next targets are $1.60 to $1.65, and eventually $1.90 .
XRP Exchange Netflow and XRP ETF Netflow: A Tale of Two MarketsThe current market dynamic is best understood by looking at two opposing data streams: XRP Exchange netflow and XRP ETF flows.
Exchange Dynamics (Retail / Whales):
Data shows a complex pattern of "large inflows and increasing reserves." Recently, a Ripple-associated wallet moved 75 million XRP (approx. $108 million) to Coinbase. This initially looks like a dump, but context matters. These transfers are likely to provide liquidity for Ripple’s ODL business, not necessarily spot market selling. However, the result is that exchange reserves have climbed to 2.76 billion XRP .
The Good News: While reserves are high, the rate of increase is slowing. Specifically, "whale" transfers to exchanges have dropped 98% from their April 11 peak. The Binance reserve has slightly decreased from 27.7 to 27.6 billion. The aggressive selling from large holders appears to have stopped.
Institutional Dynamics (ETF):
While whales were sending coins to exchanges, institutions were buying XRP ETF products. XRP ETF net flow is strongly positive.
US-listed XRP ETFs recorded four consecutive days of inflows totaling $38.86 million recently .The weekly inflow for mid-April hit $119.6 million, a multi-month high .Cumulative net inflows stand at $12.8 billion, with Assets Under Management (AUM) at roughly $10.8 billion.Analyzing the Divergence: Why Both Flows Are PositiveIt seems contradictory that exchange reserves are high (suggesting selling) while ETFs are buying (suggesting buying). However, this phenomenon reveals the current market structure.
Different Investor Profiles: The exchange inflows likely come from short-term traders, market makers, or Ripple itself providing ODL liquidity. These are "hot" coins ready to be sold. The ETF inflows represent "sticky" capital. Institutions buying ETFs are typically long-term holders (LTHs) or asset managers who do not day-trade. They are removing liquidity from the spot market by buying through custodians.The "De-risking" Trade: Sophisticated funds might be engaging in basis trading. They buy the ETF (taking a long position) while simultaneously shorting XRP futures or selling spot inventory to capture the funding rate. This keeps the price stable while volume increases.Absorption: The most likely scenario is that the market is simply absorbing the excess supply. The fact that the price is stable ($1.43) and not collapsing to $1.20 despite 2.76 billion coins sitting on exchanges is a massive win for the bulls. The ETF inflows are acting as a sponge, soaking up the selling pressure from the ODL wallets.The Regulatory Catalyst: The SEC and the CLARITY ActFundamentally, the recent price action cannot be separated from regulation. For years, the primary answer was the SEC lawsuit. That narrative is dying.
Ripple CEO Brad Garlinghouse recently praised SEC Chair Paul Atkins as "a breath of fresh air and sanity" . This regulatory thaw is critical. The SEC is reportedly considering dropping the long-standing lawsuit, and five XRP ETF applications are awaiting review.
The major catalyst on the horizon is the CLARITY Act. A Senate markup is expected before the end of April. Standard Chartered analysts project that if the bill advances, it could unlock $4 to $8 billion in institutional flows . Polymarket gives the bill a 60-66% chance of passing in 2026. If the CLARITY Act classifies XRP as a non-security (commodity), the institutional floodgates will open, likely overwhelming the $1.45 supply wall instantly.
Is XRP a Good Investment in 2026?Given all this data, is XRP a good investment? The answer depends entirely on your risk tolerance and time horizon.
The Bull Case (Why it is a good investment): The risk/reward ratio is asymmetrical to the upside. The price is near multi-year lows relative to its utility. Whale selling has stopped, ETF demand is rising, and the network is expanding (8 million wallets, quantum resistance roadmap). If the CLARITY Act passes, XRP could realistically trade between $1.60 and $1.80 in the short term, with a potential run to $3.00+ if the lawsuit is officially dropped.The Risk Case (Why it is NOT a good investment): There is a clear resistance wall at $1.45. If the CLARITY Act fails or is delayed past May (due to midterm election dynamics), the "buy the rumor, sell the news" dynamic could reverse. If the price fails to break $1.45 and loses support at $1.33, a drop back to $1.15 is technically possible .Verdict: XRP is a speculative buy for traders looking for a volatility spike. It is a hold for current investors. For new investors, it is only a good investment if you believe in regulatory clarity within the next 30 days. Technically, waiting for a confirmed break above $1.55 (to avoid the fakeout) is safer than buying at $1.43.
FAQQ: Will XRP go up if the CLARITY Act passes?
A: Yes, historically. Analysts predict that if the CLARITY Act passes, signaling that XRP is a commodity, it would remove the regulatory overhang. This could trigger a surge in institutional buying, pushing the price from the current $1.43 range to test the $1.80 - $2.00 resistance levels quickly.
Q: Why is XRP dropping when Bitcoin is going up?
A: XRP has specific supply dynamics. Unlike Bitcoin, which has a fixed supply issuance, XRP faces periodic sell-pressure from Ripple's treasury wallets used to fund ODL (liquidity) services. Additionally, the $1.45 "break-even" wall causes XRP to drop relative to BTC when short-term traders exit.
Q: Is a volatility spike imminent for XRP?
A: Yes. The Bollinger Bands on the daily chart are squeezing. The price is stuck between support at $1.33 and resistance at $1.45. Historically, when XRP volume surges 23% in a week (as it did on April 21), it precedes a violent move. The direction depends on whether the $1.45 resistance breaks.
Q: What is the XRP ETF netflow status?
A: As of late April 2026, XRP ETFs are seeing positive netflows. The US ETFs recorded a single week inflow of $119.6 million in mid-April. Cumulative inflows are strong at $12.8 billion, indicating that institutions are accumulating during this dip, which is a long-term bullish signal for price stabilization.
Q: Is XRP a good investment for beginners?
A: XRP is less volatile than "meme coins" but more volatile than Bitcoin. For beginners, it is a moderate-risk investment. Its value is tied to real utility (bank payments). However, beginners should wait to see if the price can close a weekly candle above $1.55 before entering, to avoid buying into the current resistance wall.
Disclaimer: None of the information in this article constitutes, or is intended to constitute, investment advice. Trading cryptocurrencies carries a high level of risk and may not be suitable for all investors. Always do your own research.
About WEEXFounded in 2018, WEEX has developed into a global crypto exchange with over 6.2 million users across more than 150 countries. The platform emphasizes security, liquidity, and usability, providing over 1,200 spot trading pairs and offering up to 400x leverage in crypto futures trading. In addition to the traditional spot and derivatives markets, WEEX is expanding rapidly in the AI era — delivering real-time AI news, empowering users with AI trading tools, and exploring innovative trade-to-earn models that make intelligent trading more accessible to everyone. Its 1,000 BTC Protection Fund further strengthens asset safety and transparency, while features such as copy trading and advanced trading tools allow users to follow professional traders and experience a more efficient, intelligent trading journey.
Follow WEEX on social mediaX: @WEEX_Official
Instagram: @WEEX Exchange
Tiktok: @weex_global
Youtube: @WEEX_Official
Discord: WEEX Community
Telegram: WeexGlobal Group
FC Barcelona vs Celta Vigo: Can Anyone Stop Barcelona at Home?
FC Barcelona vs Celta Vigo lineups, standings, and stats for April 22, 2026. FC Barcelona need a win to stay on track for the La Liga title. Full preview inside.
Carl Moon & WEEX Head to Mugello: The Crypto Trader's Ferrari Challenge
Forget the sidelines. WEEX is hitting the 300km/h mark at Mugello this weekend. Witness Carl Moon’s transformation from a supermarket cashier to a Ferrari racer, and discover why the world’s fastest trading floor belongs on the world’s most technical track at the official Ferrari Challenge.
How to Become a Pro Crypto Trader: WEEX Interview with Ferrari Racer Carl Moon
Ferrari racer Carl Moon on mastering crypto trading: 80/20 rule, AI tools, Bitcoin at $95K, and risk lessons from the track.
